Fig. 8.
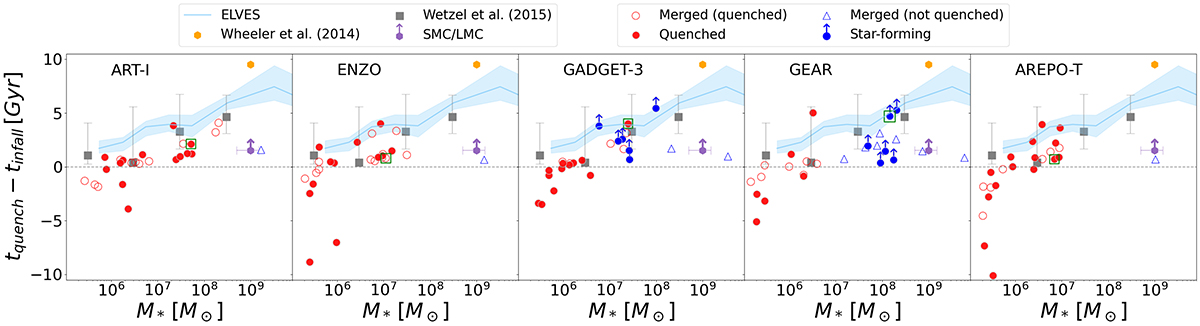
Download original image
Quenching delay time of satellite galaxies as a function of their stellar mass. Quenched satellites are represented by red filled circles, while star-forming satellites are indicated by blue arrows, marking a lower limit on their quenching delay times. Satellites that merged when Mhost>5×10¹¹ M⊙ are also shown: red open circles denote those quenched before merging, and blue open triangles denote those that were not (they still have either ongoing star formation or star-forming gas reservoirs at the time of merger). Observational estimates from Wetzel et al. (2015a), and Wheeler et al. (2014) are shown in gray squares and orange hexagons, respectively. An estimate of the quenching timescale for the SMC/LMC system is shown in purple, using the infall time predicted by Kallivayalil et al. (2013). The quenching time for the ELVES survey (Greene et al. 2023) is also shown in blue. The open green square enclosing a single data point in each panel indicates the same satellite across the different models and we compare its evolution in Section 3.4.2 and in Figures 9 and 10.
Current usage metrics show cumulative count of Article Views (full-text article views including HTML views, PDF and ePub downloads, according to the available data) and Abstracts Views on Vision4Press platform.
Data correspond to usage on the plateform after 2015. The current usage metrics is available 48-96 hours after online publication and is updated daily on week days.
Initial download of the metrics may take a while.