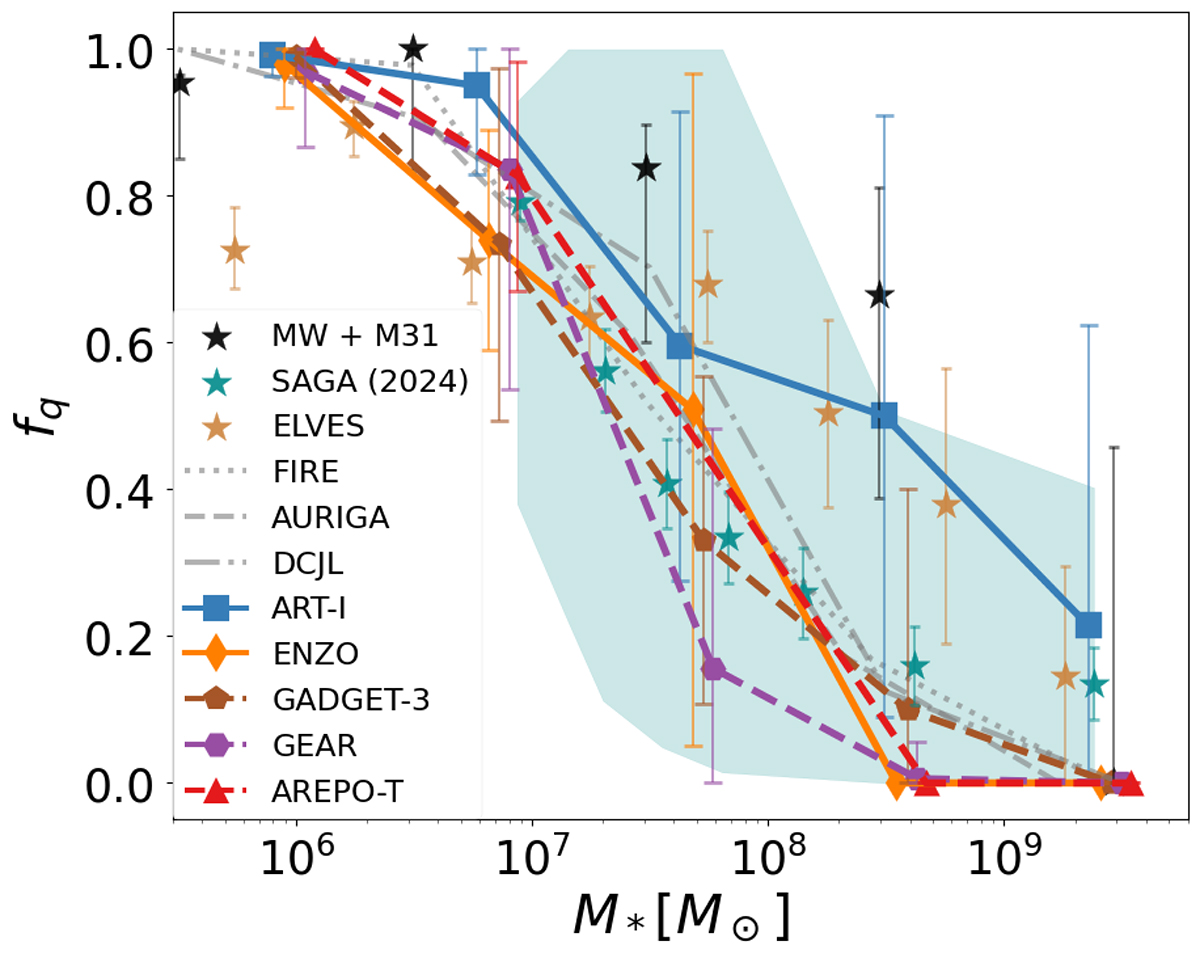
Fig. 7.
Download original image
Quenched fractions of satellite galaxies of the CosmoRun target galaxy as a function of stellar mass for each CosmoRun model. Each model is represented by a colored line. In order to match with observations, here a satellite galaxy is defined as quenched if sSFR<10−11 yr−1. Due to a lack of host statistics, we used a common number of 50 snapshots from z<1, when our host halo is above the critical mass for virial shock formation in all models, up to z∼0.3, the last available snapshot for GADGET-3 and GEAR, to ensure a consistent comparison between models. Each marker represents the mean value across different snapshots for each mass bin, with error bars indicating the standard deviation. Markers have been slightly displaced for clarity, but they represent the same stellar mass bin. We compare our quenched fractions with observations of the LG (from Wetzel et al. 2015a updated with Putman et al. 2021 as in Samuel et al. 2022), as well as data from the “Gold” and “Silver” sample of the SAGA Survey (Geha et al. 2024) and findings from the ELVES survey (Carlsten et al. 2022). The cyan shaded region represents the SAGA host-to-host 1σ scatter. Additionally, quenched fractions from other cosmological simulations of Milky Way analogs are shown with gray dotted, dashed, and dash-dotted lines: FIRE (Samuel et al. 2022), AURIGA (Simpson et al. 2018), and the ChaNGa DC Justice League (DCJL) (Akins et al. 2021), respectively. We note that both the observational data and the simulations from other groups we compare against are at z = 0. Since the range used in our case to calculate the mean quenched fraction for each mass bin is between z = 1 and z∼0.3, our fq can be interpreted as a lower limit for the expected quenched fraction at z = 0.
Current usage metrics show cumulative count of Article Views (full-text article views including HTML views, PDF and ePub downloads, according to the available data) and Abstracts Views on Vision4Press platform.
Data correspond to usage on the plateform after 2015. The current usage metrics is available 48-96 hours after online publication and is updated daily on week days.
Initial download of the metrics may take a while.