Fig. 6.
Download original image
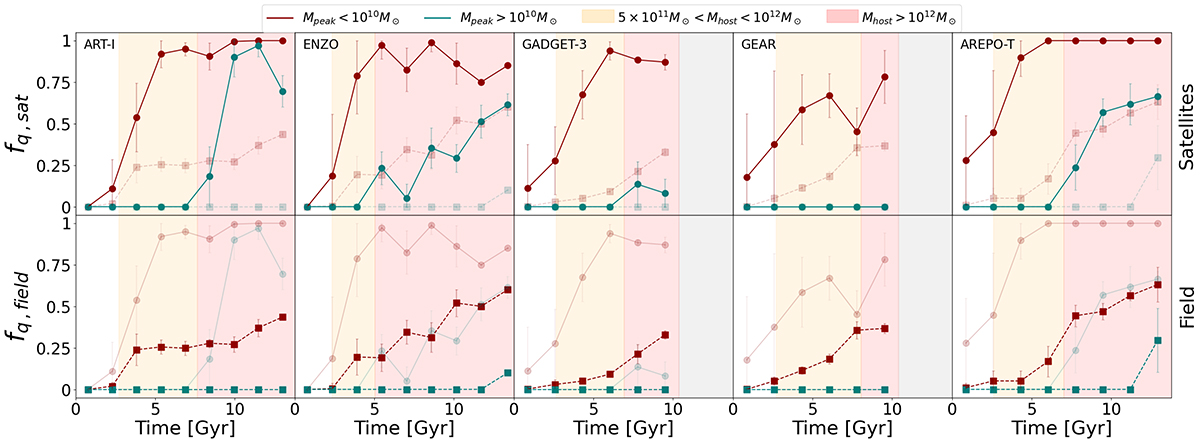
Evolution of the fraction of quenched satellite galaxies (top and circle markers) across cosmic time compared with the quenched fraction of field galaxies (bottom and square markers) for each model. Markers indicate the mean fq for each time bin, and the error bars represent the standard deviation. In the row where we show the quenched fraction of the satellites, we also display that of the field galaxies with higher transparency and vice versa to facilitate comparison. We follow the quenching definition described in Section 2.3. The orange and red shaded regions represent the epochs when the host halo is more massive than 5×10¹¹ M⊙ and 1012 M⊙, respectively. The time domain where snapshots are still not available for each specific code are indicated as a gray shaded region. Quenched fractions for satellite galaxies and field galaxies above and below Mpeak = 1010 M⊙ are shown in different colors.
Current usage metrics show cumulative count of Article Views (full-text article views including HTML views, PDF and ePub downloads, according to the available data) and Abstracts Views on Vision4Press platform.
Data correspond to usage on the plateform after 2015. The current usage metrics is available 48-96 hours after online publication and is updated daily on week days.
Initial download of the metrics may take a while.