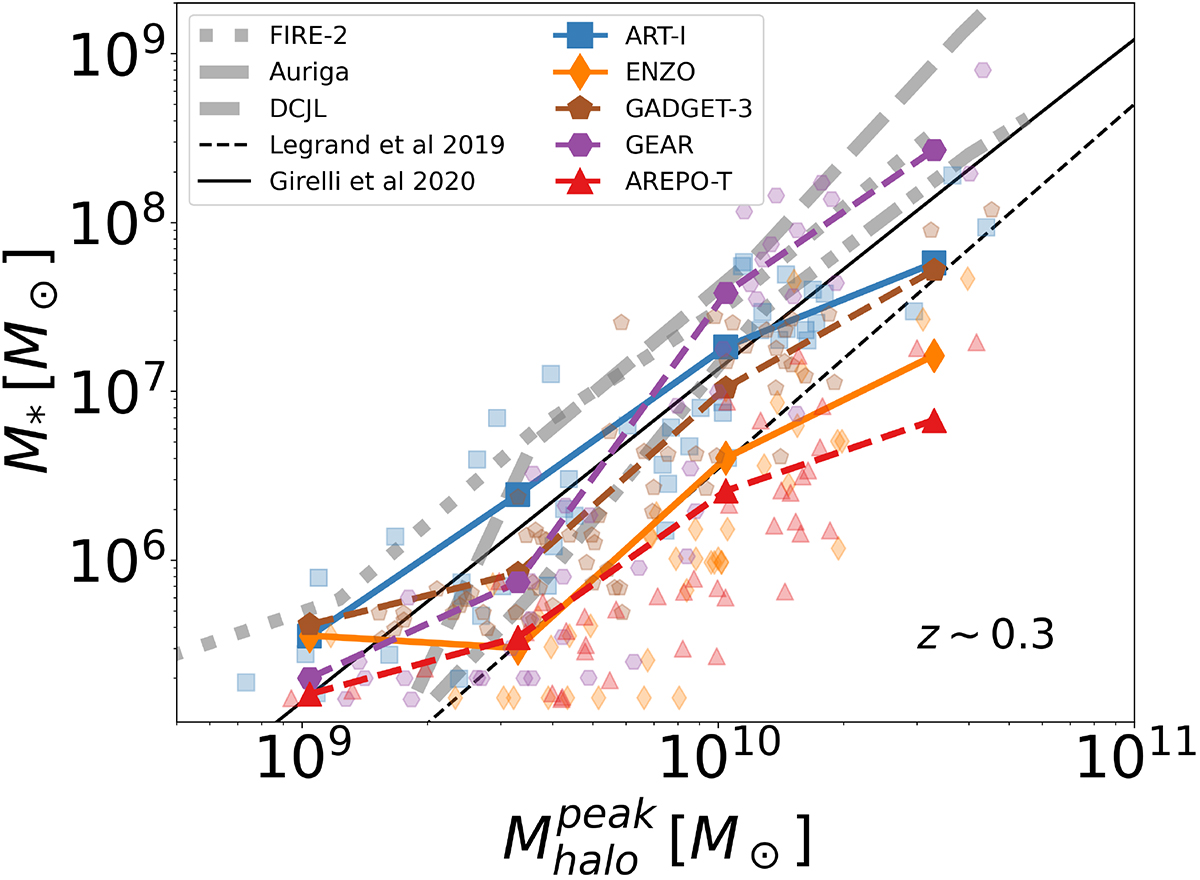
Fig. 5.
Download original image
Stellar-to-halo mass relation at z∼0.3 for the five CosmoRun models reaching z<1. Each galaxy is plotted as a single marker. Solid and dashed colored lines represent the mean value of stellar masses in each peak halo mass bin for each model. The gray dotted, dashed and dot-dashed lines are for dwarf galaxies in other cosmological zoom-in simulations at z = 0 (FIRE-2, Auriga and DC Justice League, respectively; Hopkins et al. 2018; Grand et al. 2021; Munshi et al. 2021). The solid and dashed black lines without markers are semi-empirical models for 0.2<z<0.5 with extrapolation to low-mass galaxies (Legrand et al. 2019; Girelli et al. 2020).
Current usage metrics show cumulative count of Article Views (full-text article views including HTML views, PDF and ePub downloads, according to the available data) and Abstracts Views on Vision4Press platform.
Data correspond to usage on the plateform after 2015. The current usage metrics is available 48-96 hours after online publication and is updated daily on week days.
Initial download of the metrics may take a while.