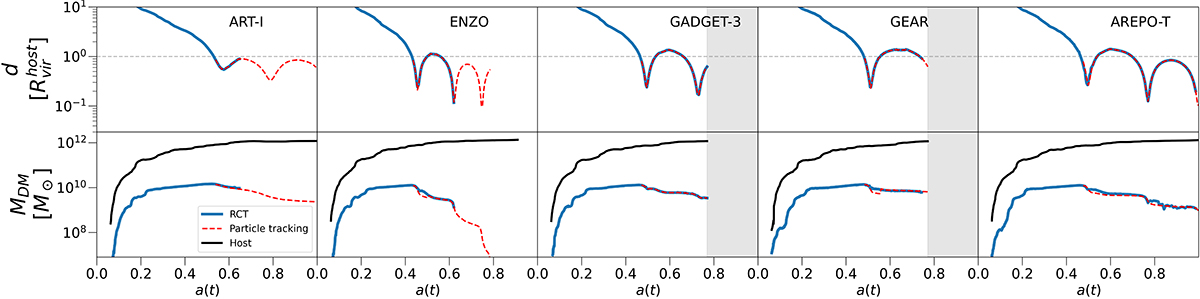
Fig. 2.
Download original image
Evolution of the same subhalo over time for all the models, as measured by both RCT (ROCKSTAR + Consistent-Trees; blue solid line) and our algorithm (red dashed line), until the last snapshot available for each run. The time domain where snapshots are still not available for each specific code are indicated as a gray shaded region. Top: Subhalo's trajectory during its infall to the host halo. The host virial radius is indicated by the horizontal gray dashed line. Bottom: Evolution of the subhalo mass compared to the host halo (black dashed line).
Current usage metrics show cumulative count of Article Views (full-text article views including HTML views, PDF and ePub downloads, according to the available data) and Abstracts Views on Vision4Press platform.
Data correspond to usage on the plateform after 2015. The current usage metrics is available 48-96 hours after online publication and is updated daily on week days.
Initial download of the metrics may take a while.