Fig. 14.
Download original image
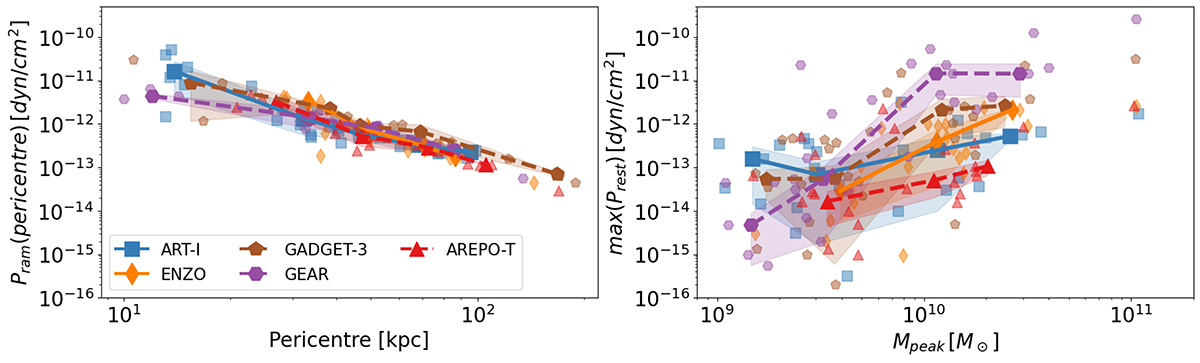
Comparison of intercode differences in the ram pressure experienced by satellites and their restoring pressure. Left: Ram pressure felt by satellites during their first pericenter as a function of pericenter distance. Right: Maximum restoring pressure of each satellite as a function of their peak halo mass. Each marker represents an individual satellite, while the colored lines denote the median values for each CosmoRun model in each bin, with the shaded regions indicating the median absolute deviation. The codes differ significantly more in the restoring pressure of each satellite than in the ram pressure exerted by the host CGM.
Current usage metrics show cumulative count of Article Views (full-text article views including HTML views, PDF and ePub downloads, according to the available data) and Abstracts Views on Vision4Press platform.
Data correspond to usage on the plateform after 2015. The current usage metrics is available 48-96 hours after online publication and is updated daily on week days.
Initial download of the metrics may take a while.