Fig. 10.
Download original image
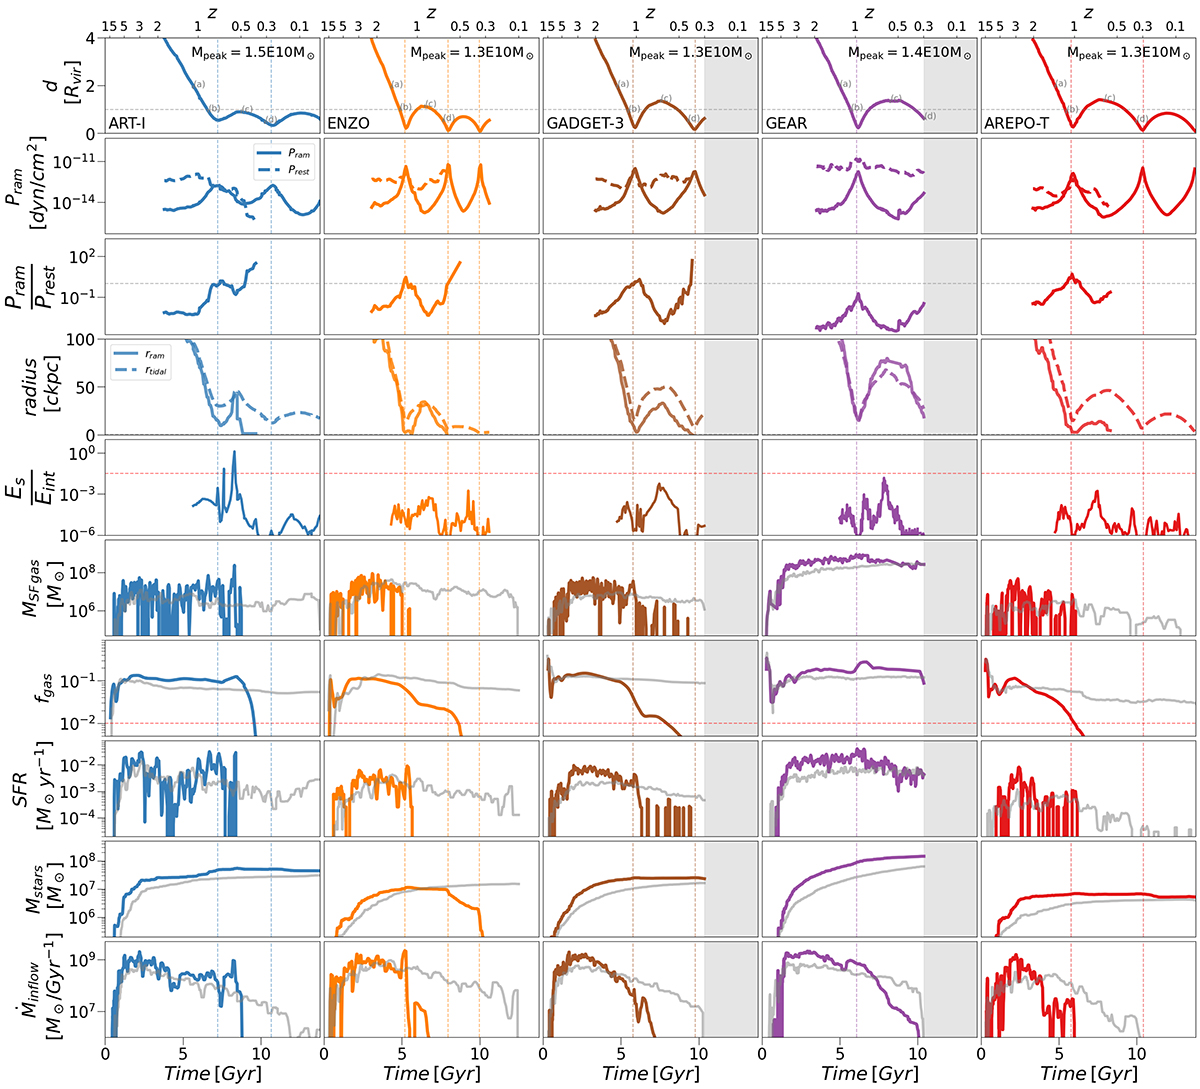
Evolution of the same satellite as in Figure 9 across all the models. First row: Trajectory during their infall into the host halo. Second row: Evolution of the ram pressure (solid line) felt by the gas and the restoring force (dashed line) per unit area. Both lines begin when the satellite comes within ![]() and Prest is defined as long as the satellite contain gas. Third row: Evolution of the ratio of ram pressure to the restoring force per unit area. Gray horizontal dashed line marks Pram/Prest = 1. Fourth row: Comparison between the tidal and ram pressure radius, represented as dashed and solid lines, respectively. Fifth row: Ratio between Es and Eint to identify high velocity satellite-satellite encounter. Red horizontal dashed line marks the threshold
and Prest is defined as long as the satellite contain gas. Third row: Evolution of the ratio of ram pressure to the restoring force per unit area. Gray horizontal dashed line marks Pram/Prest = 1. Fourth row: Comparison between the tidal and ram pressure radius, represented as dashed and solid lines, respectively. Fifth row: Ratio between Es and Eint to identify high velocity satellite-satellite encounter. Red horizontal dashed line marks the threshold ![]() . Sixth row: Evolution of the star-forming gas mass, defined as gas with nH>1 cm−3 and a temperature below 104 K. Seventh row: Evolution of the ratio Mgas/Mhalo, the 1% is marked as a red dashed line for reference. Eighth row: SFR evolution, usually named Star Formation History (SFH). Ninth row: Evolution of the stellar mass. Stellar mass loss serves as an effective tracer for tidal stripping in the ISM. Tenth row: Mass inflow rate evolution for studying the effect of strangulation. Gray background lines in rows six to ten represent the evolution of the same parameter for field galaxies with Mpeak>1010 M⊙ for each model. The time domain where snapshots are still not available for each specific code are indicated as a gray shaded region. Vertical dashed lines mark the pericenter passages for each model. The same plot for a sample of (intercode matched) satellite galaxies can be found at this link, where examples of galaxies of different masses and following more radial or more tangential orbits are provided.
. Sixth row: Evolution of the star-forming gas mass, defined as gas with nH>1 cm−3 and a temperature below 104 K. Seventh row: Evolution of the ratio Mgas/Mhalo, the 1% is marked as a red dashed line for reference. Eighth row: SFR evolution, usually named Star Formation History (SFH). Ninth row: Evolution of the stellar mass. Stellar mass loss serves as an effective tracer for tidal stripping in the ISM. Tenth row: Mass inflow rate evolution for studying the effect of strangulation. Gray background lines in rows six to ten represent the evolution of the same parameter for field galaxies with Mpeak>1010 M⊙ for each model. The time domain where snapshots are still not available for each specific code are indicated as a gray shaded region. Vertical dashed lines mark the pericenter passages for each model. The same plot for a sample of (intercode matched) satellite galaxies can be found at this link, where examples of galaxies of different masses and following more radial or more tangential orbits are provided.
Current usage metrics show cumulative count of Article Views (full-text article views including HTML views, PDF and ePub downloads, according to the available data) and Abstracts Views on Vision4Press platform.
Data correspond to usage on the plateform after 2015. The current usage metrics is available 48-96 hours after online publication and is updated daily on week days.
Initial download of the metrics may take a while.