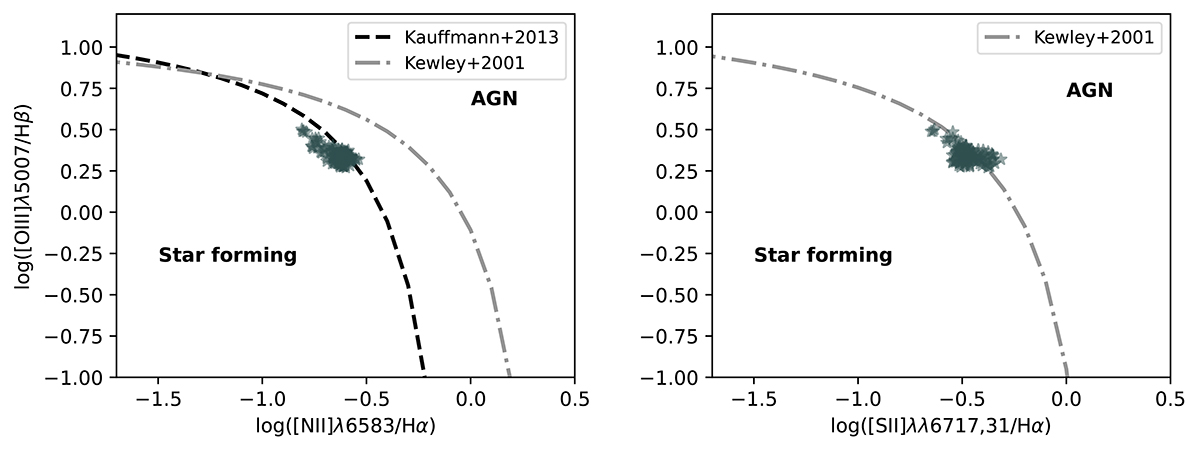
Fig. 6.
Download original image
Baldwin, Phillips and Terlevich diagrams using flux measured for each spaxel with S/N > 15 in both components of the merging system. In both panels, Kewley et al. (2001) theoretical division is traced with a gray dashed-dot line. The empirical division of Kauffmann et al. (2003) is also shown in the left-hand panel with a black dashed line. The intermediate zone between the empirical and theoretical divisions in the left-hand panel is known as the composite zone.
Current usage metrics show cumulative count of Article Views (full-text article views including HTML views, PDF and ePub downloads, according to the available data) and Abstracts Views on Vision4Press platform.
Data correspond to usage on the plateform after 2015. The current usage metrics is available 48-96 hours after online publication and is updated daily on week days.
Initial download of the metrics may take a while.