Open Access
Fig. 2.
Download original image
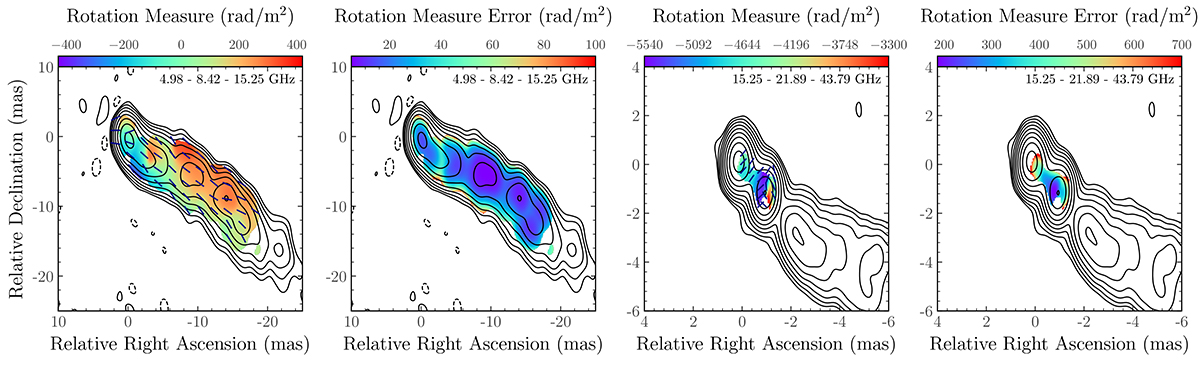
Rotation measure maps of 3C 273 using 5–8–15 GHz (left column, top) and 15–22–43 GHz (left column, bottom) and its respective errors (right column). Corrected (intrinsic) EVPAs are plotted as dark blue ticks.
Current usage metrics show cumulative count of Article Views (full-text article views including HTML views, PDF and ePub downloads, according to the available data) and Abstracts Views on Vision4Press platform.
Data correspond to usage on the plateform after 2015. The current usage metrics is available 48-96 hours after online publication and is updated daily on week days.
Initial download of the metrics may take a while.