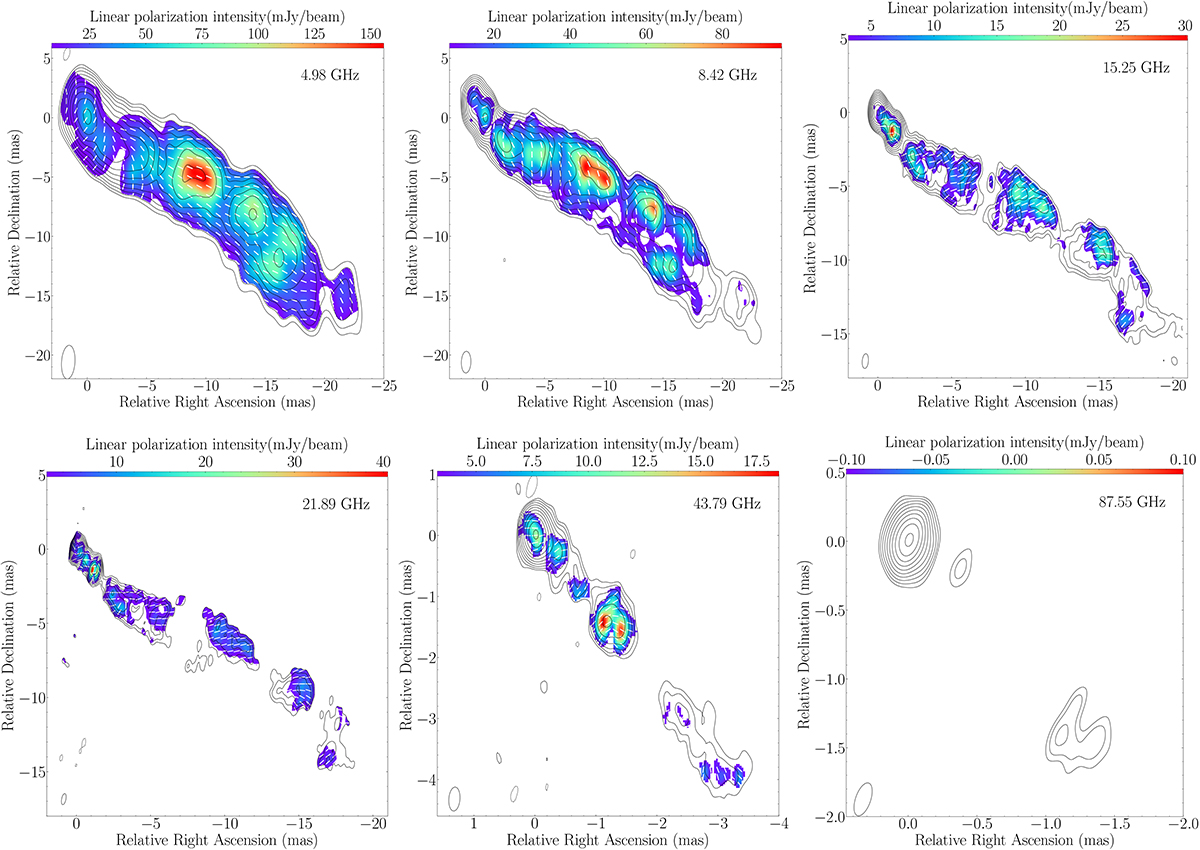
Fig. 1.
Download original image
VLBA total and linear polarisation images at different frequencies. Contours show total intensity above a threshold of 5σ; colour scale represents the linearly polarised intensity above 4σ; white ticks indicate the observed electric vector position angle. The peak value of total flux density is 2.83, 2.67, 1.55, 2.08, 3.89, 2.42 Jy/beam for 5, 8, 15, 22, 43, and 86 GHz, respectively. The corresponding rms is 12.55, 4.01, 1.96, 1.23, 2.64, and 5.49 mJy/beam.
Current usage metrics show cumulative count of Article Views (full-text article views including HTML views, PDF and ePub downloads, according to the available data) and Abstracts Views on Vision4Press platform.
Data correspond to usage on the plateform after 2015. The current usage metrics is available 48-96 hours after online publication and is updated daily on week days.
Initial download of the metrics may take a while.