Fig. 6.
Download original image
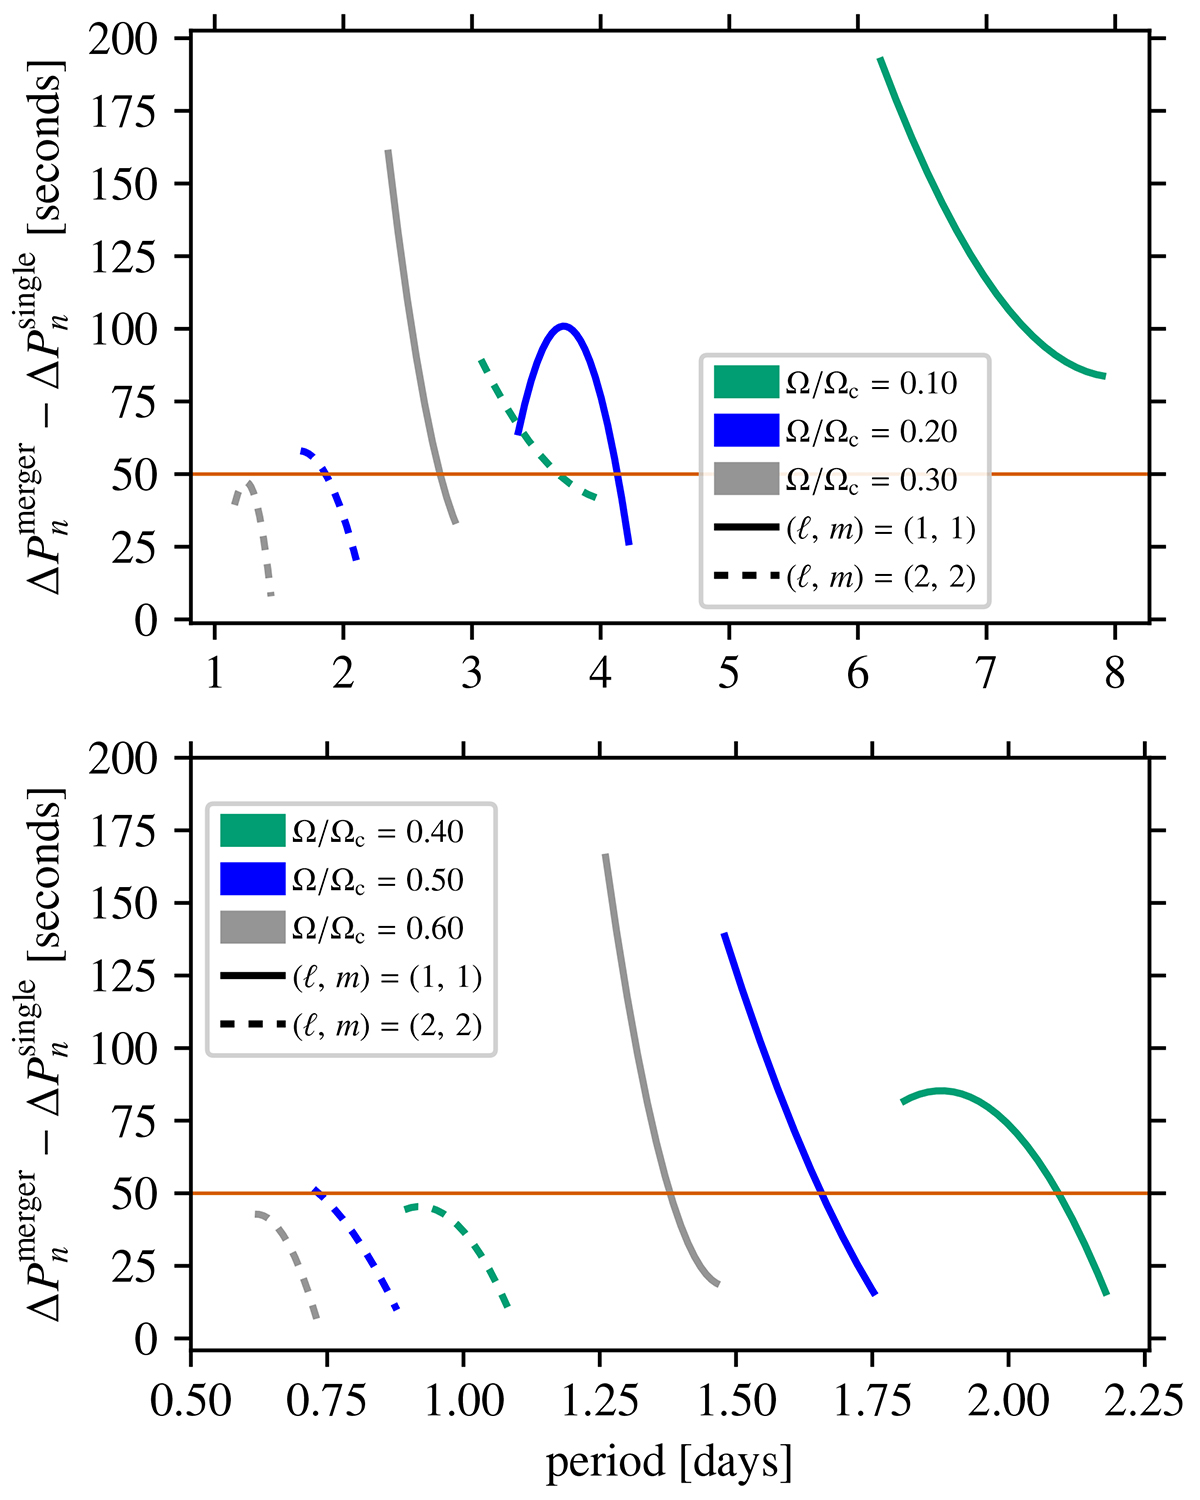
Differences between the quadratic function fits of the PSPs for prograde modes shown in Fig. 5 for Ω/Ωc=0.10−0.30 (top) and Ω/Ωc=0.40−0.60 (bottom). The solid and dashed lines show the differences for the (ℓ, m)=(1, 1) and (ℓ, m)=(2, 2) modes, respectively. The horizontal red line shows the average value of σΔP from observations of SPB pulsators.
Current usage metrics show cumulative count of Article Views (full-text article views including HTML views, PDF and ePub downloads, according to the available data) and Abstracts Views on Vision4Press platform.
Data correspond to usage on the plateform after 2015. The current usage metrics is available 48-96 hours after online publication and is updated daily on week days.
Initial download of the metrics may take a while.