Fig. 4.
Download original image
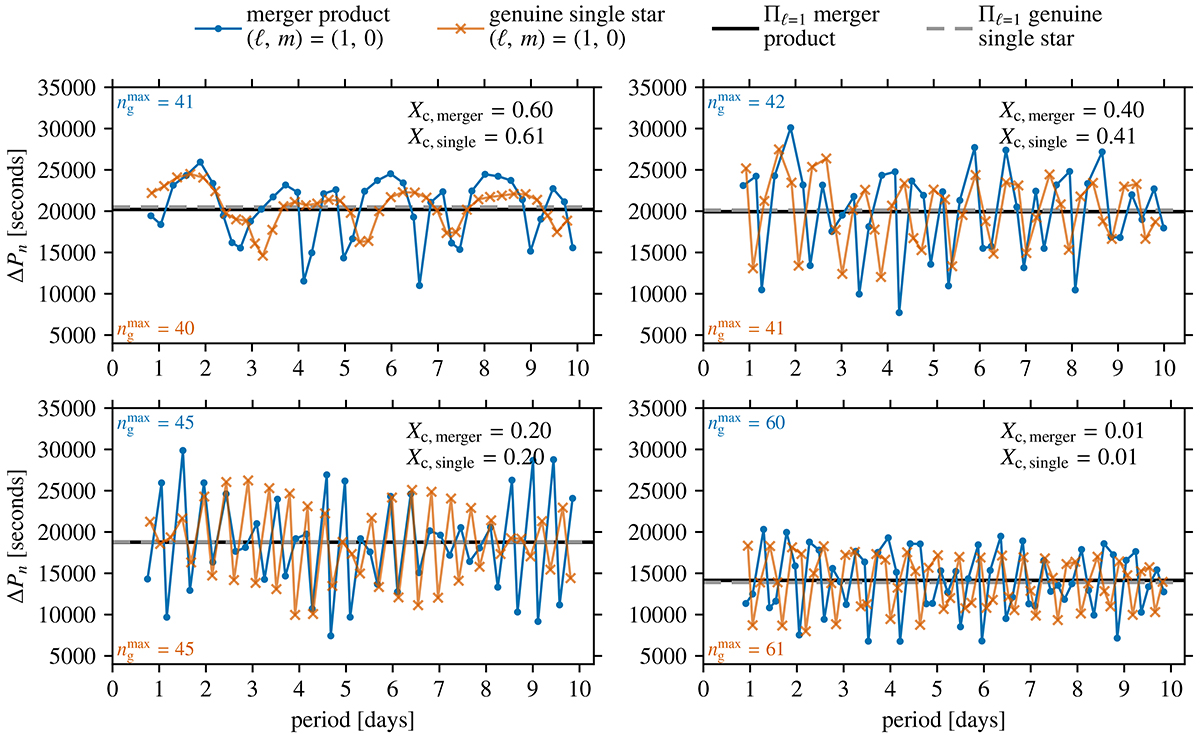
Period spacing patterns for ℓ=1 g modes without rotation for the 16.9 M⊙ 3D MHD merger product (blue solid lines, dot markers) and the 17.4 M⊙ genuine single star (orange solid lines, cross markers) at different evolutionary stages. The horizontal solid black and dashed grey lines indicate the values of the asymptotic period spacing values Πℓ=1 for the merger product and genuine single star, respectively. The ![]() values show the maximum radial order plotted for the merger product (blue) and genuine single star (red).
values show the maximum radial order plotted for the merger product (blue) and genuine single star (red).
Current usage metrics show cumulative count of Article Views (full-text article views including HTML views, PDF and ePub downloads, according to the available data) and Abstracts Views on Vision4Press platform.
Data correspond to usage on the plateform after 2015. The current usage metrics is available 48-96 hours after online publication and is updated daily on week days.
Initial download of the metrics may take a while.