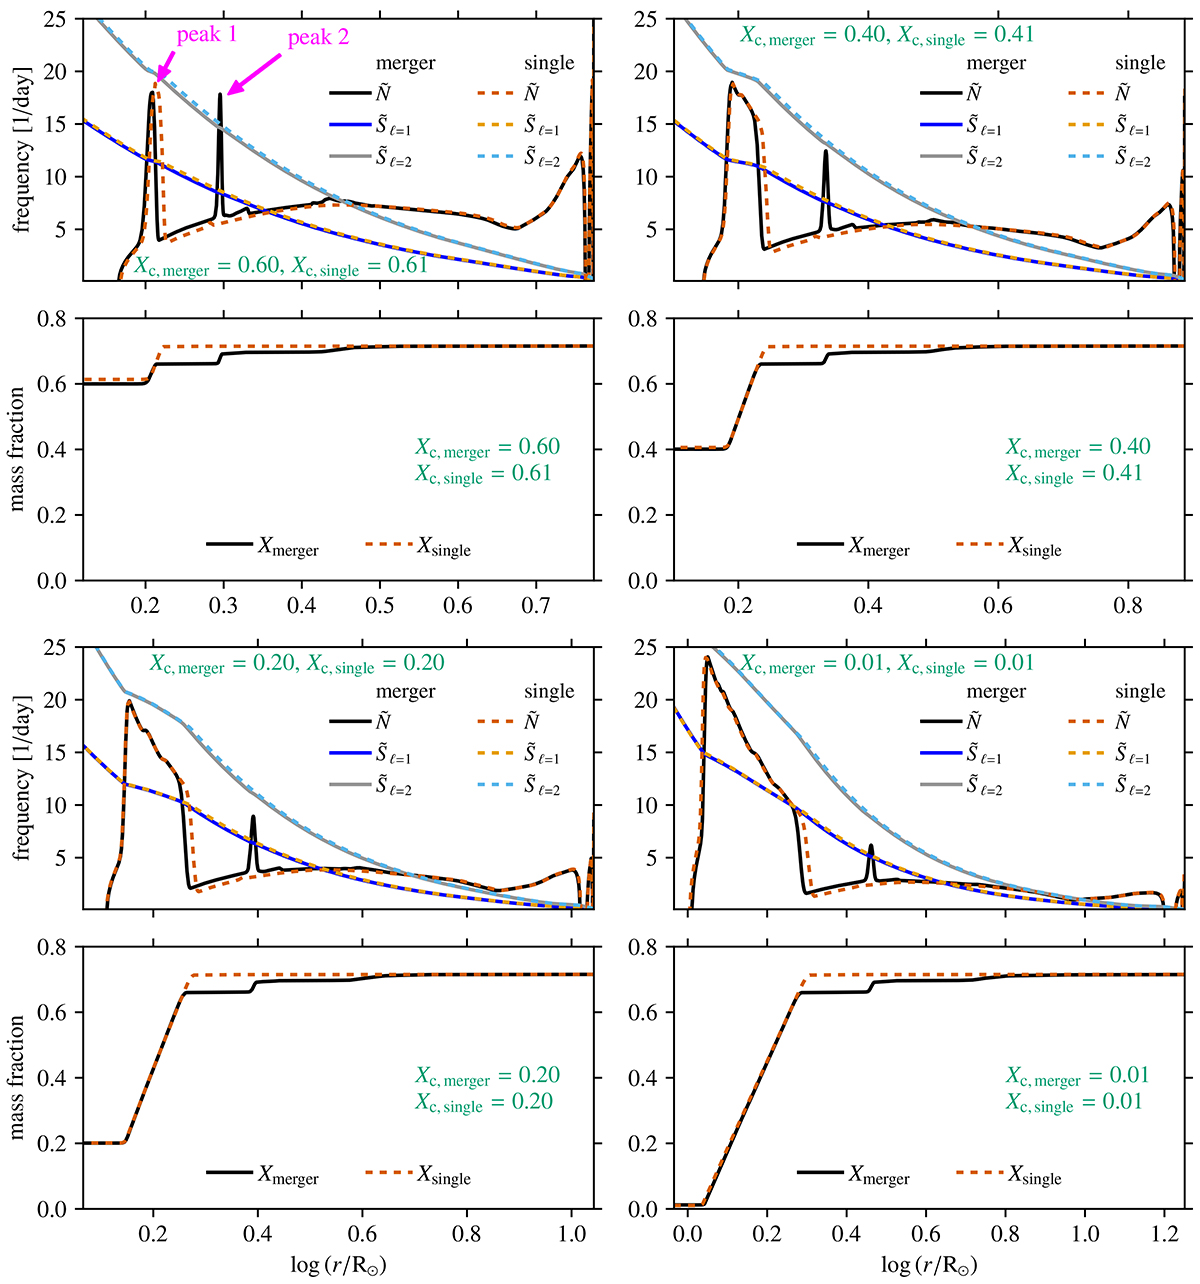
Fig. 2.
Download original image
Evolution of the propagation diagrams (odd rows) and hydrogen mass fraction X profiles (even rows) for the 16.9 M⊙ 3D MHD merger product (solid lines) and the 17.4 M⊙ genuine single star (dashed lines). Each panel is labelled with the corresponding central hydrogen mass fractions of the merger product and the genuine single star.
Current usage metrics show cumulative count of Article Views (full-text article views including HTML views, PDF and ePub downloads, according to the available data) and Abstracts Views on Vision4Press platform.
Data correspond to usage on the plateform after 2015. The current usage metrics is available 48-96 hours after online publication and is updated daily on week days.
Initial download of the metrics may take a while.