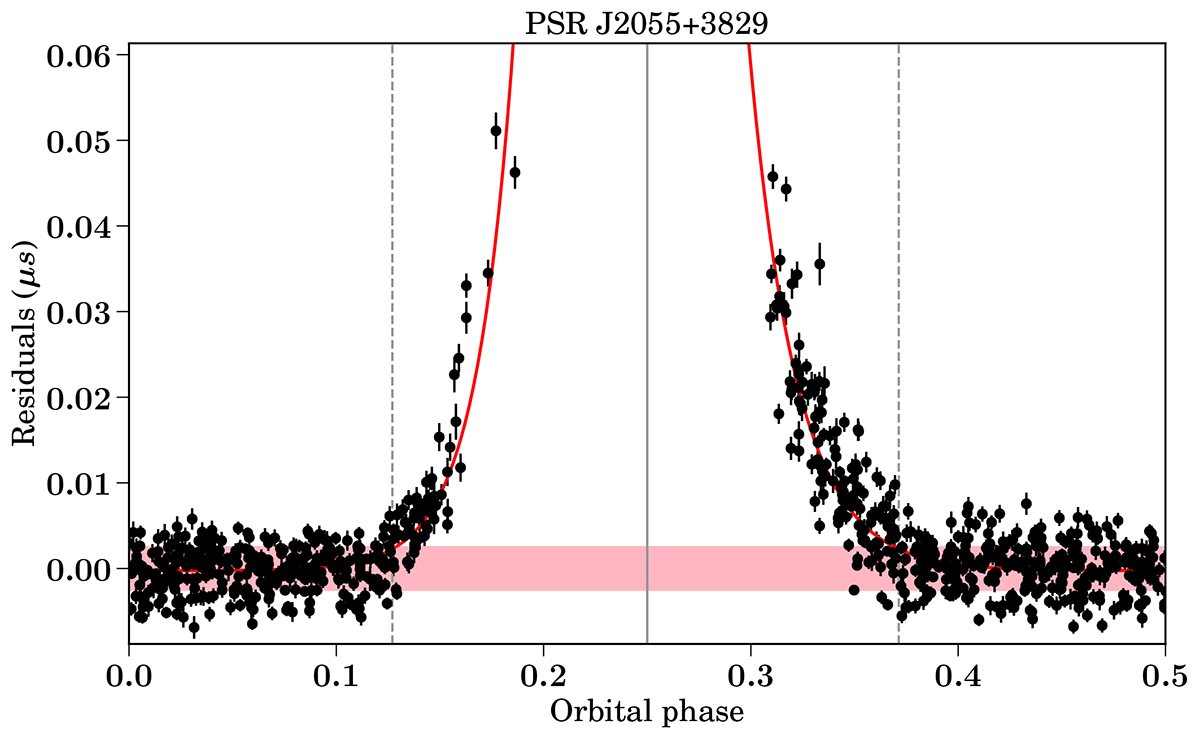
Fig. 5.
Download original image
Timing residuals as a function of orbital phase around superior conjunction, indicated with a solid line for PSR J2055+3829. The best-fit function obtained from the analysis presented in Sect. 3.3 is shown in red. The light red zone shows the RMS of the timing residuals for orbital phases ϕ > 0.5, and the dashed vertical lines correspond to the values of Φstart and Φend as inferred from the fit.
Current usage metrics show cumulative count of Article Views (full-text article views including HTML views, PDF and ePub downloads, according to the available data) and Abstracts Views on Vision4Press platform.
Data correspond to usage on the plateform after 2015. The current usage metrics is available 48-96 hours after online publication and is updated daily on week days.
Initial download of the metrics may take a while.