Fig. 4.
Download original image
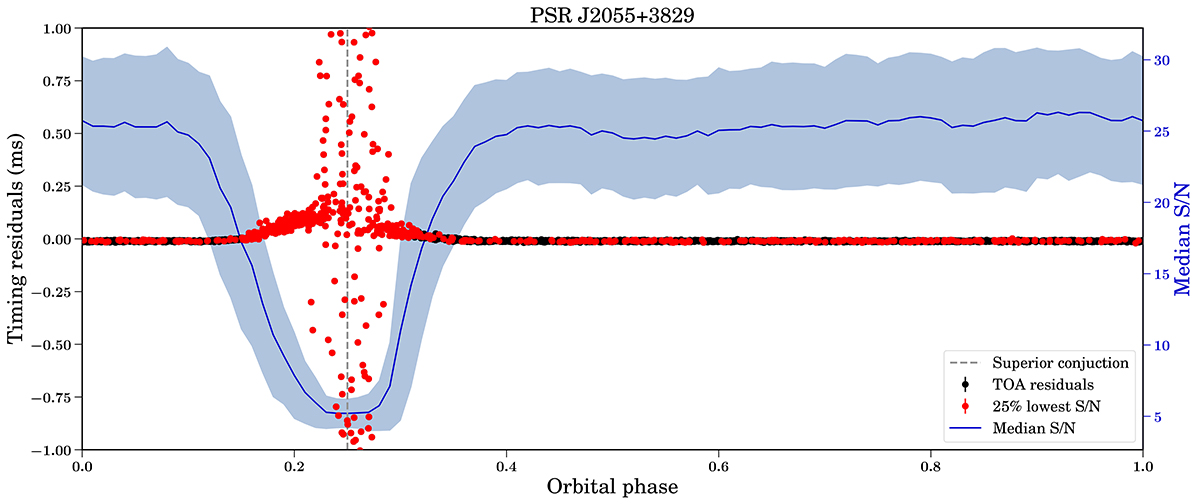
Timing residuals and median S/N values as a function of orbital phase for PSR J2055+3829. The TOA residuals are shown as red and black dots, with red dots corresponding to observations with S/N values among the 25% lowest. Error bars, which are much smaller than the vertical scale, are not visible in this figure. The blue curve is the median S/N of the TOAs computed over sliding windows of width 0.1 in orbital phase, and the blue zone shows the median absolute deviation around the median values. The dashed vertical line corresponds to superior conjunction, at orbital phase 0.25.
Current usage metrics show cumulative count of Article Views (full-text article views including HTML views, PDF and ePub downloads, according to the available data) and Abstracts Views on Vision4Press platform.
Data correspond to usage on the plateform after 2015. The current usage metrics is available 48-96 hours after online publication and is updated daily on week days.
Initial download of the metrics may take a while.