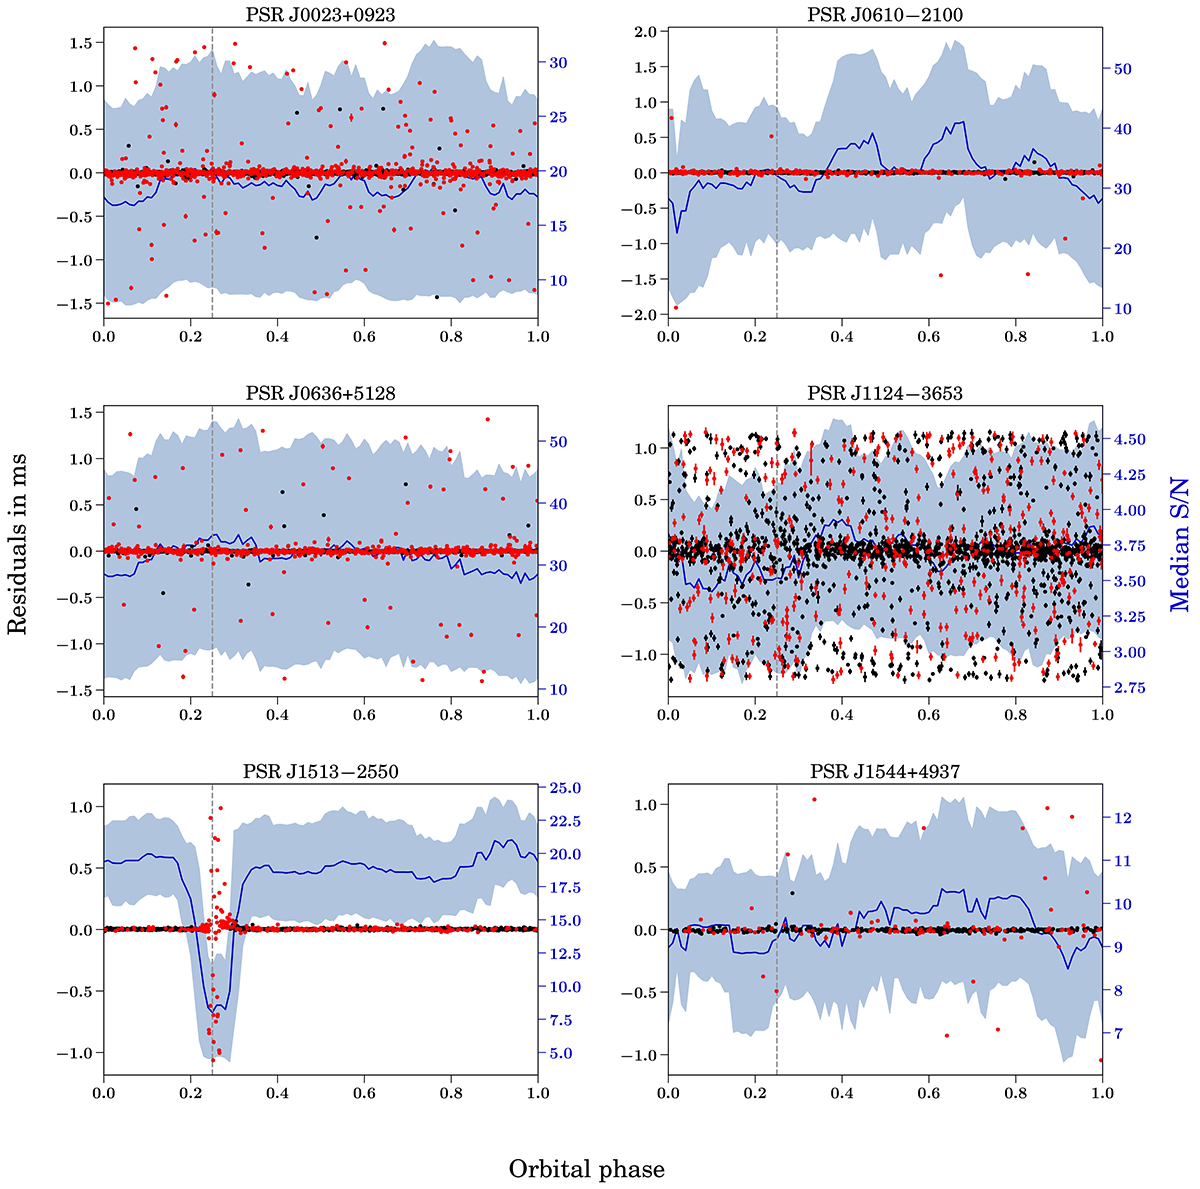
Fig. A.1.
Download original image
Same as Fig. 4 but for PSRs J0023+0923, J0610−2100, J0636+5128, J1124−3653, J1513−2550 and J1544+4937. We note that in this figure S/N histograms and corresponding axes are shown in blue. TOA residuals are shown as red and black dots. Red dots correspond to observations with S/N values among the 25% lowest. Dashed vertical lines indicate superior conjunction, corresponding to orbital phase 0.25. In some plots the error bars are too small to be apparent.
Current usage metrics show cumulative count of Article Views (full-text article views including HTML views, PDF and ePub downloads, according to the available data) and Abstracts Views on Vision4Press platform.
Data correspond to usage on the plateform after 2015. The current usage metrics is available 48-96 hours after online publication and is updated daily on week days.
Initial download of the metrics may take a while.