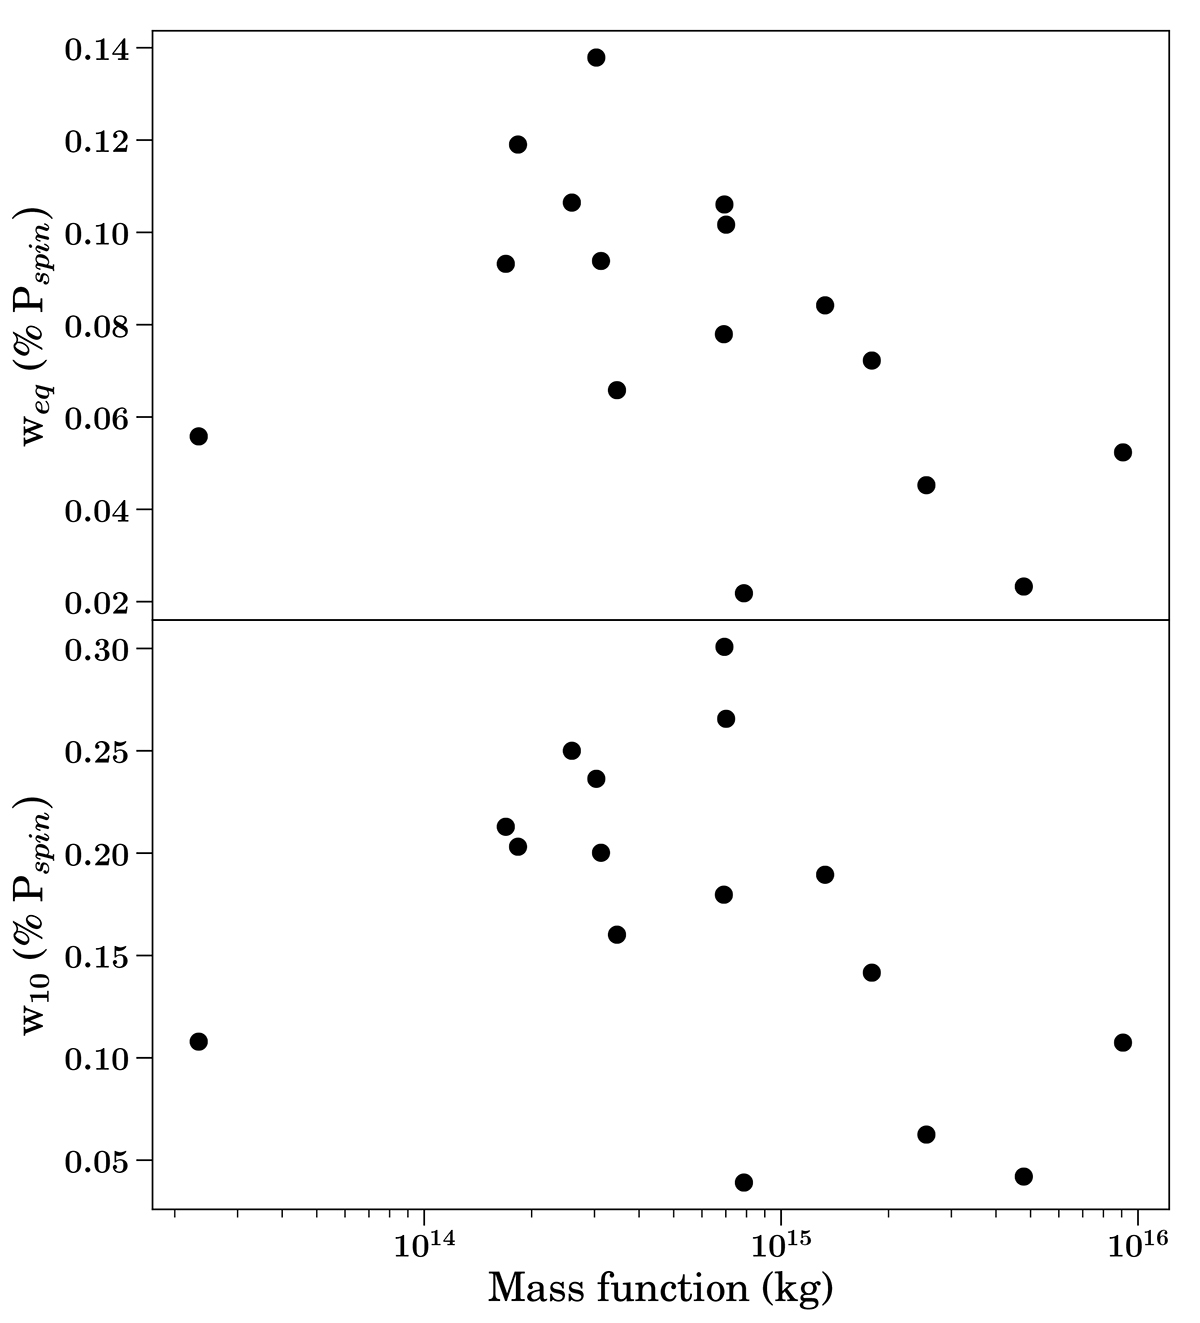
Fig. 12.
Download original image
Equivalent width (top panel) and width at 10% of the maximum (bottom panel) as a function of the mass function. The PSRs J1719−1438 and J1628−3205 are not shown for the reasons stated in Sect. 5.2, and PSR J1124−3653 is also not plotted, as the noise baseline in its pulse profile is higher than 10% of the maximum intensity (see Fig. C.1).
Current usage metrics show cumulative count of Article Views (full-text article views including HTML views, PDF and ePub downloads, according to the available data) and Abstracts Views on Vision4Press platform.
Data correspond to usage on the plateform after 2015. The current usage metrics is available 48-96 hours after online publication and is updated daily on week days.
Initial download of the metrics may take a while.