Open Access
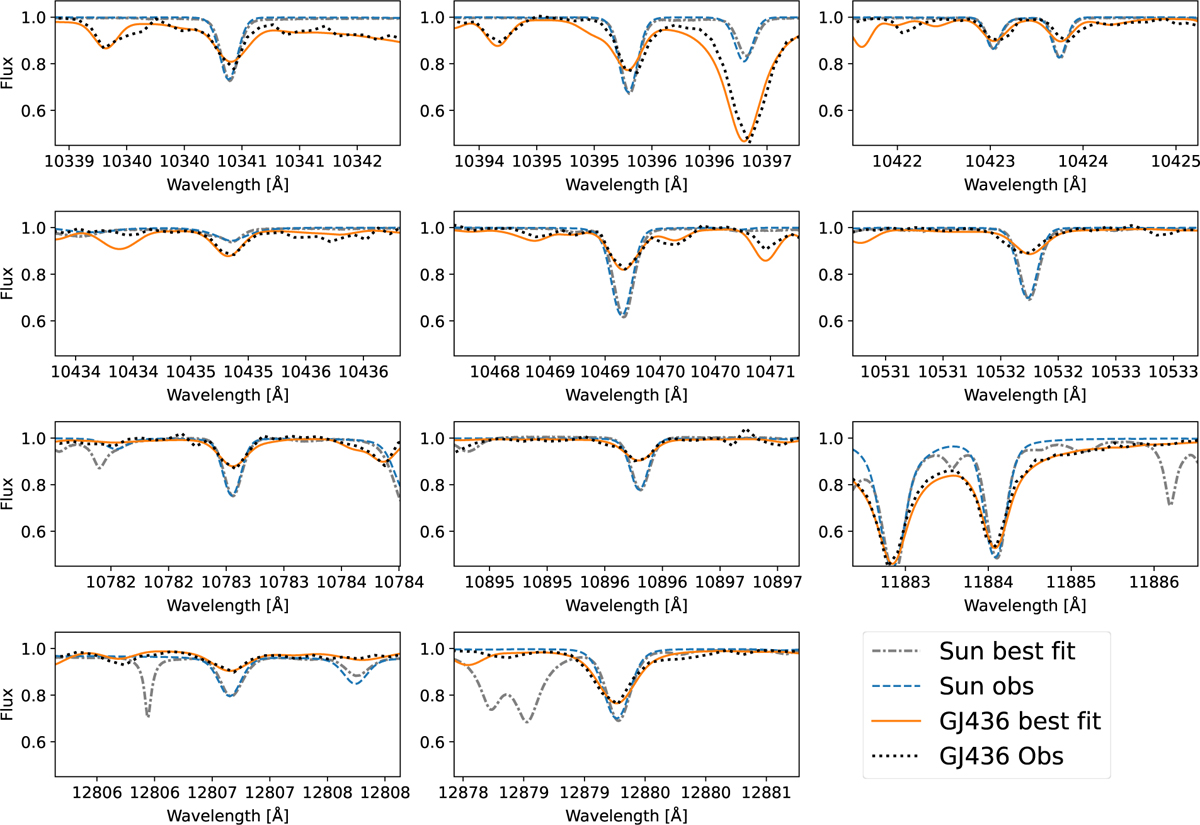
Fig. 2
Download original image
Best-fitted Fe I lines in GJ 436 and the Sun. The observed spectra were only adjusted according to the literature RV and not the RV fit for individual lines. The wavelength range 10 421 Å to 10 425 Å has two Fe lines. In the other panels, the Fe line is in the middle of the plot.
Current usage metrics show cumulative count of Article Views (full-text article views including HTML views, PDF and ePub downloads, according to the available data) and Abstracts Views on Vision4Press platform.
Data correspond to usage on the plateform after 2015. The current usage metrics is available 48-96 hours after online publication and is updated daily on week days.
Initial download of the metrics may take a while.