Open Access
Fig. E.1
Download original image
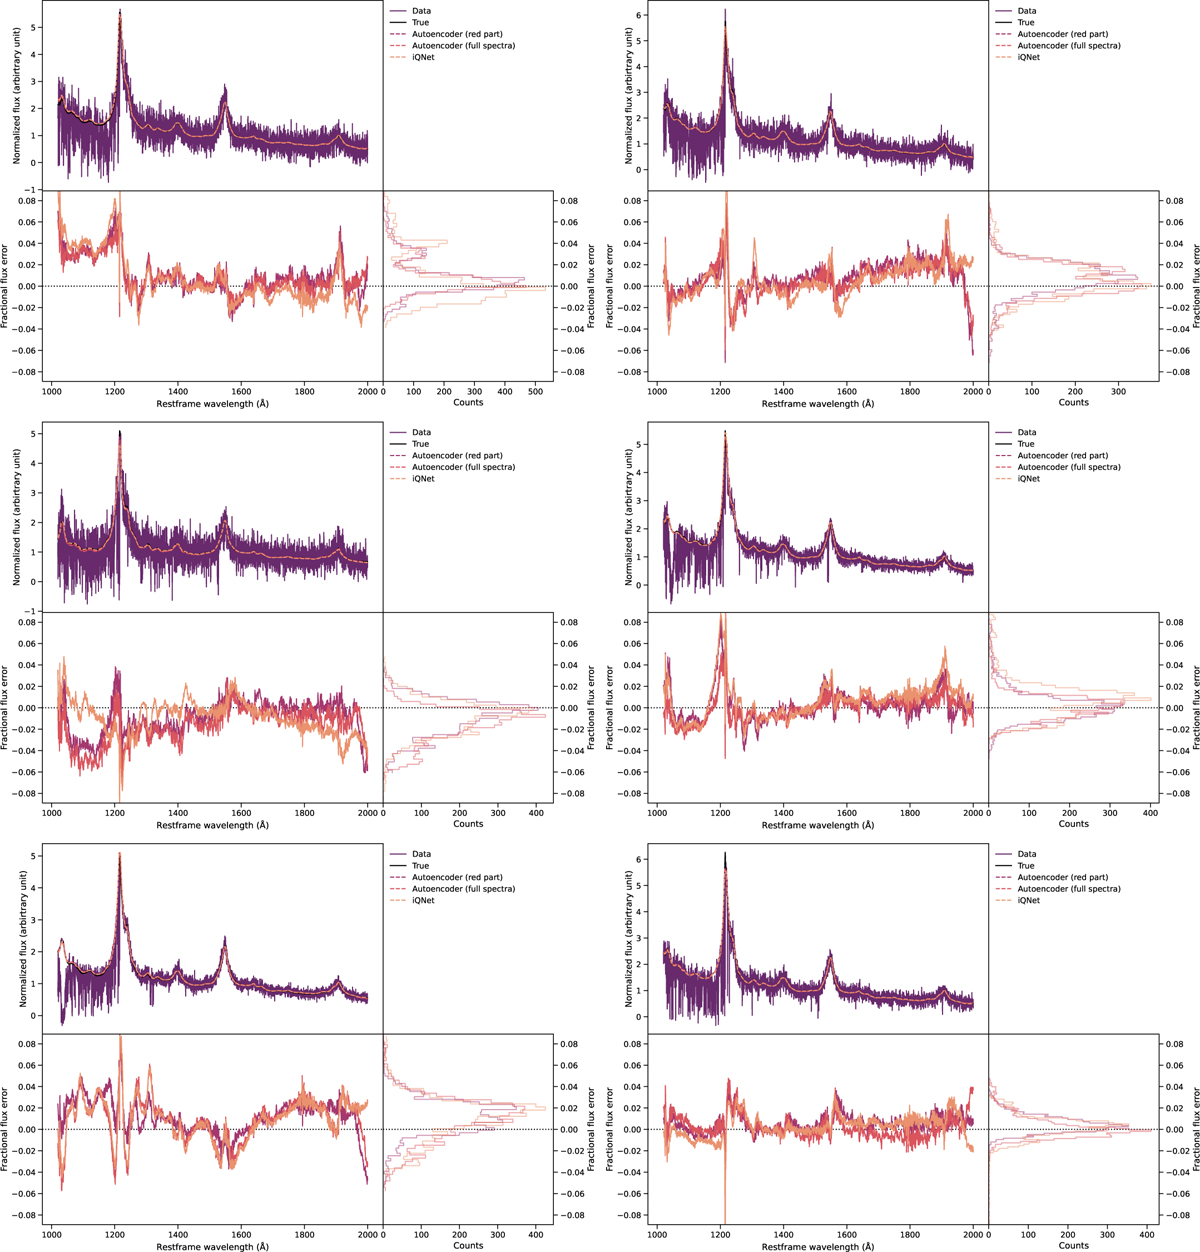
Example spectra of quasars. The top panel of each plot shows the data, the true continuum, and the fits of different runs of the autoencoders. The bottom panel shows the FFE as a function of the rest frame wavelength for different runs of the autoencoders and their distributions.
Current usage metrics show cumulative count of Article Views (full-text article views including HTML views, PDF and ePub downloads, according to the available data) and Abstracts Views on Vision4Press platform.
Data correspond to usage on the plateform after 2015. The current usage metrics is available 48-96 hours after online publication and is updated daily on week days.
Initial download of the metrics may take a while.