Fig. 1
Download original image
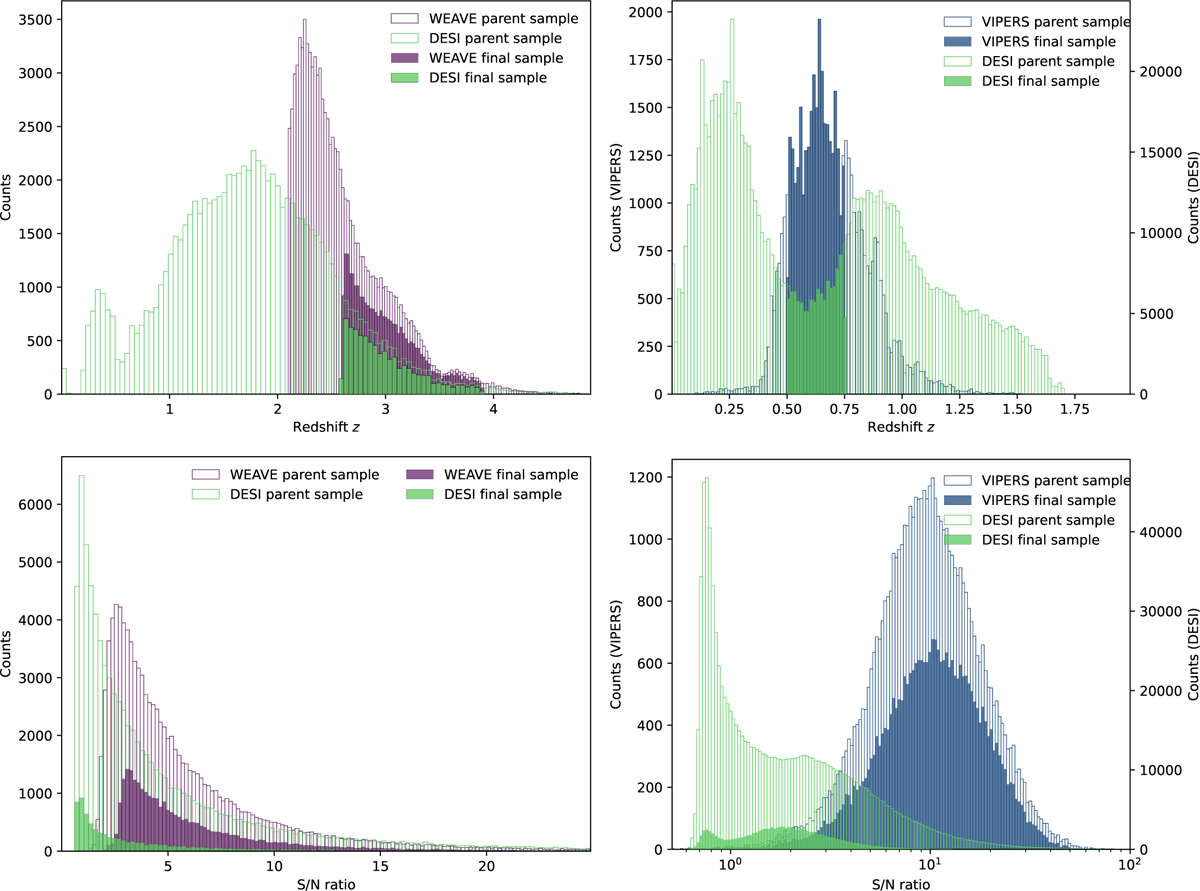
Histograms of the redshift (top panel) and S/N (bottom panel) for quasars (left column in purple for the WEAVE mock catalog and in green for DESI EDR) and galaxies (right panel in blue for the VIPERS and in green for DESI EDR). The unfilled histograms show the distributions of the parent samples, while the filled histograms show the distributions of the final samples after all the data selections.
Current usage metrics show cumulative count of Article Views (full-text article views including HTML views, PDF and ePub downloads, according to the available data) and Abstracts Views on Vision4Press platform.
Data correspond to usage on the plateform after 2015. The current usage metrics is available 48-96 hours after online publication and is updated daily on week days.
Initial download of the metrics may take a while.