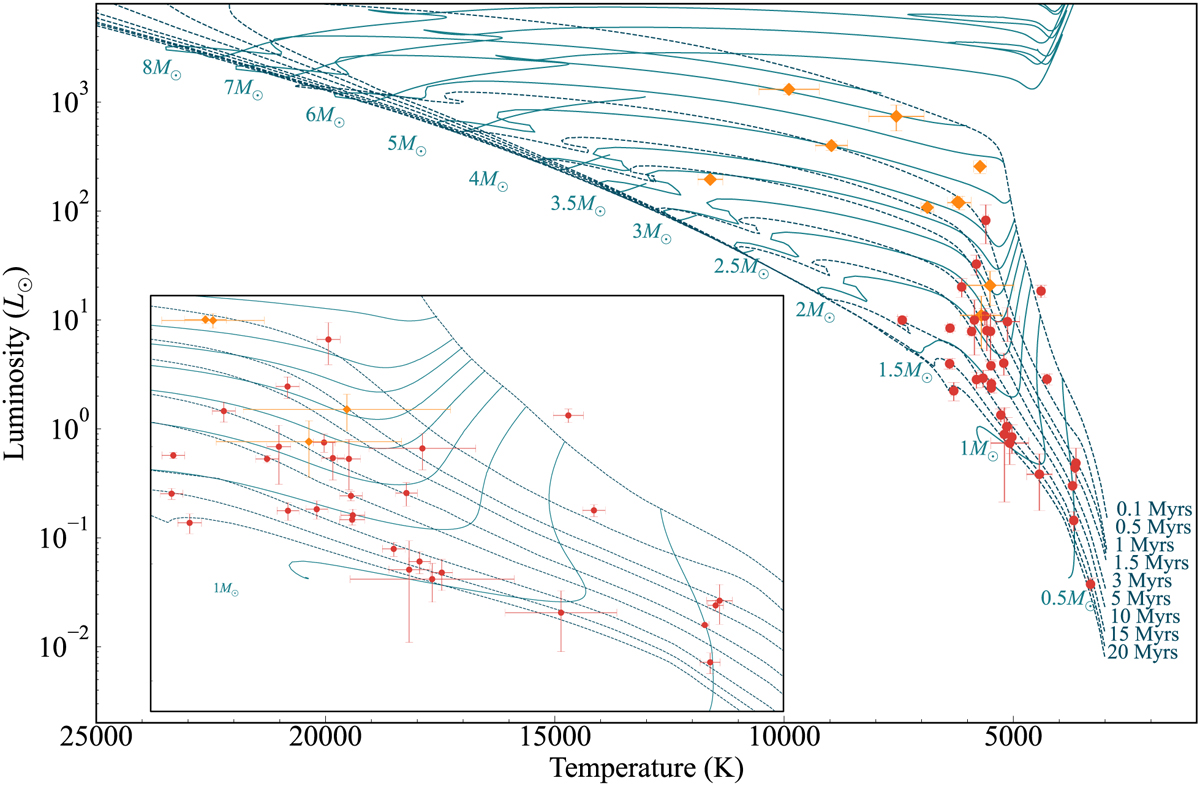
Fig. 8
Download original image
HRD of the PMS sources using spectroscopically determined Teff and L*. The red points were classified spectroscopically. The orange diamonds were classified based on SED fitting. The lcr uncertainties are represented with red error bars. A selection of isochrones are shown as turquoise dashed lines. The ages are given in Myr on the right hand side.
Current usage metrics show cumulative count of Article Views (full-text article views including HTML views, PDF and ePub downloads, according to the available data) and Abstracts Views on Vision4Press platform.
Data correspond to usage on the plateform after 2015. The current usage metrics is available 48-96 hours after online publication and is updated daily on week days.
Initial download of the metrics may take a while.