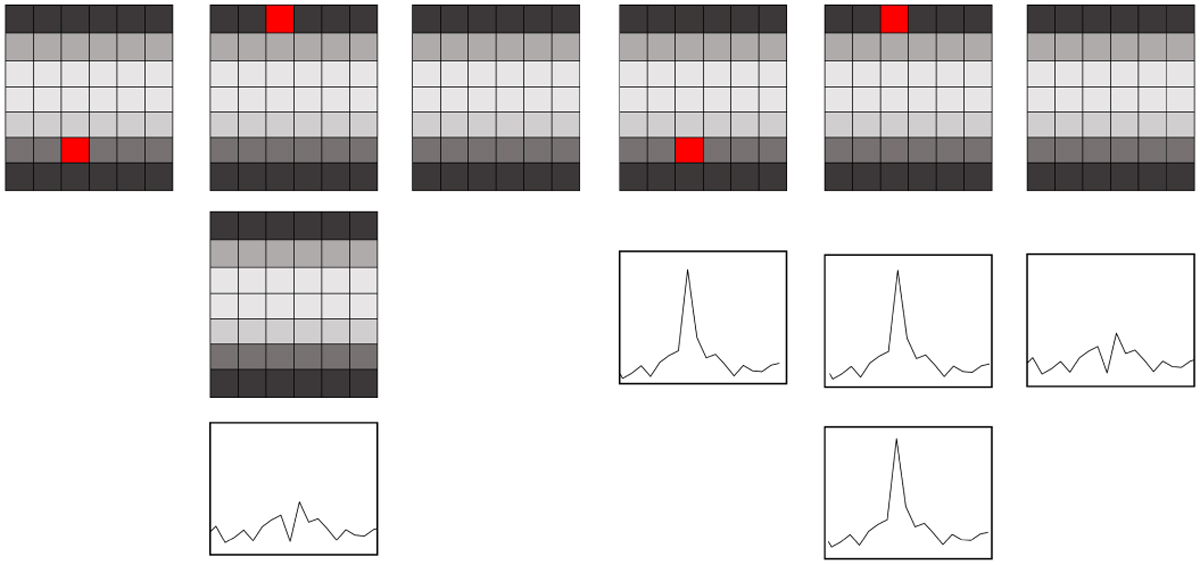
Fig. A.1
Download original image
Left panel, (top) shows three 2D spectra. Two contain a spike due to spurious pixels. (Middle) resulting 2D spectrum after averaging. Spikes are no longer present, having been averaged out. (Bottom) final median 1D spectrum with no spike. Right panel, (top) shows three 2D spectra. Two contain a spike due to a spurious pixel. (Middle) resulting 1D spectra after collapse. Both spikes are passed from the 2D to 1D spectra after collapse. (Bottom) final median 1D spectrum containing the spike.
Current usage metrics show cumulative count of Article Views (full-text article views including HTML views, PDF and ePub downloads, according to the available data) and Abstracts Views on Vision4Press platform.
Data correspond to usage on the plateform after 2015. The current usage metrics is available 48-96 hours after online publication and is updated daily on week days.
Initial download of the metrics may take a while.