Open Access
Fig. 5.
Download original image
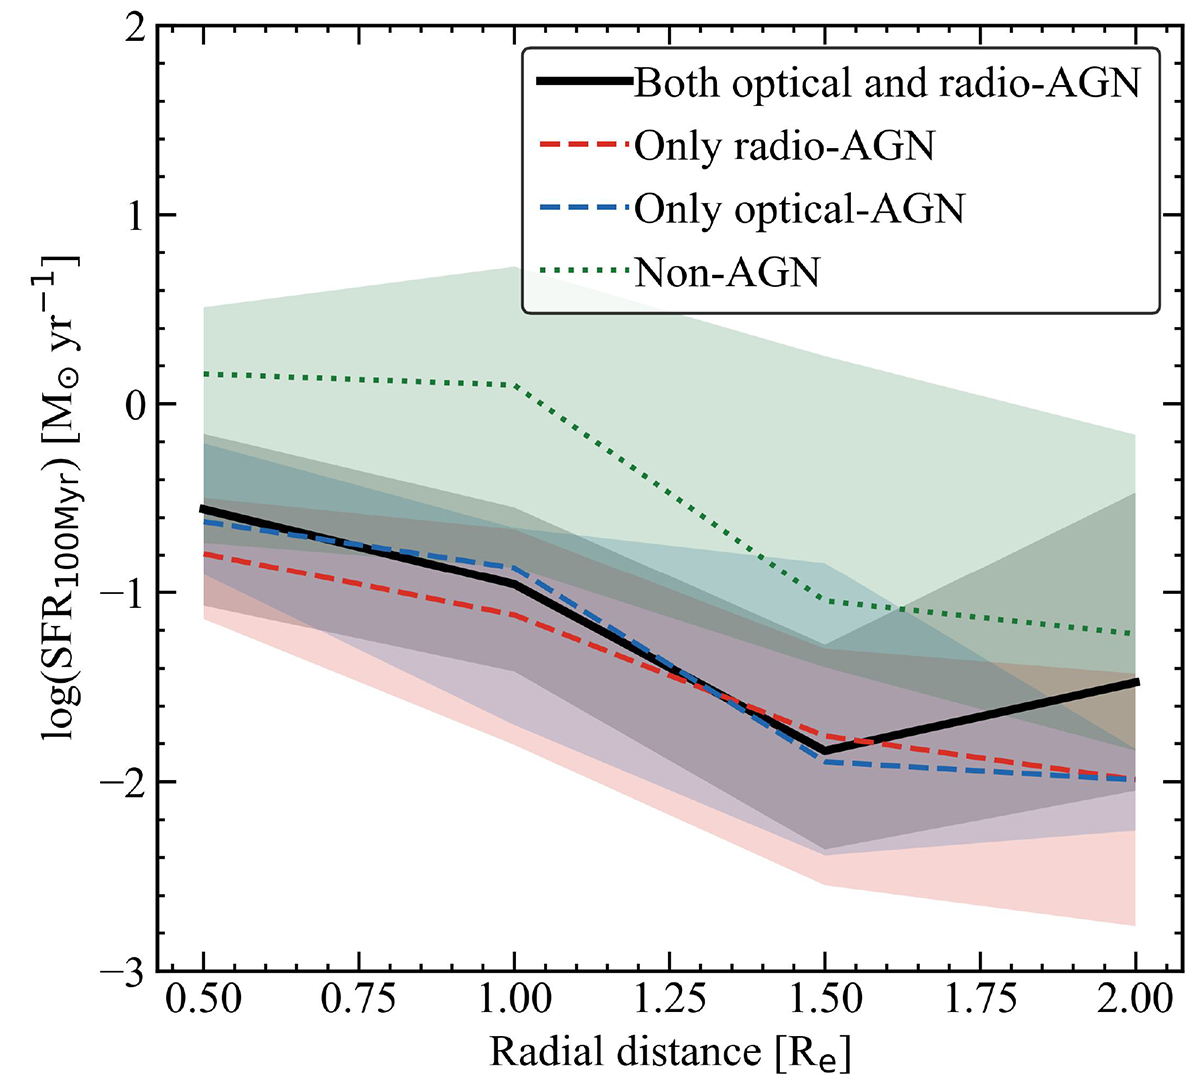
Radial profiles of recent (100 Myr) SFRs of the different source groups, discussed in Sects. 4.1 and 4.2. The lines show the median SFRs and the shaded regions mark the 25th and 75th percentile values of the SFR distributions. SFRs for the non-AGN group are larger at every radial point than the AGN groups.
Current usage metrics show cumulative count of Article Views (full-text article views including HTML views, PDF and ePub downloads, according to the available data) and Abstracts Views on Vision4Press platform.
Data correspond to usage on the plateform after 2015. The current usage metrics is available 48-96 hours after online publication and is updated daily on week days.
Initial download of the metrics may take a while.