Fig. 4.
Download original image
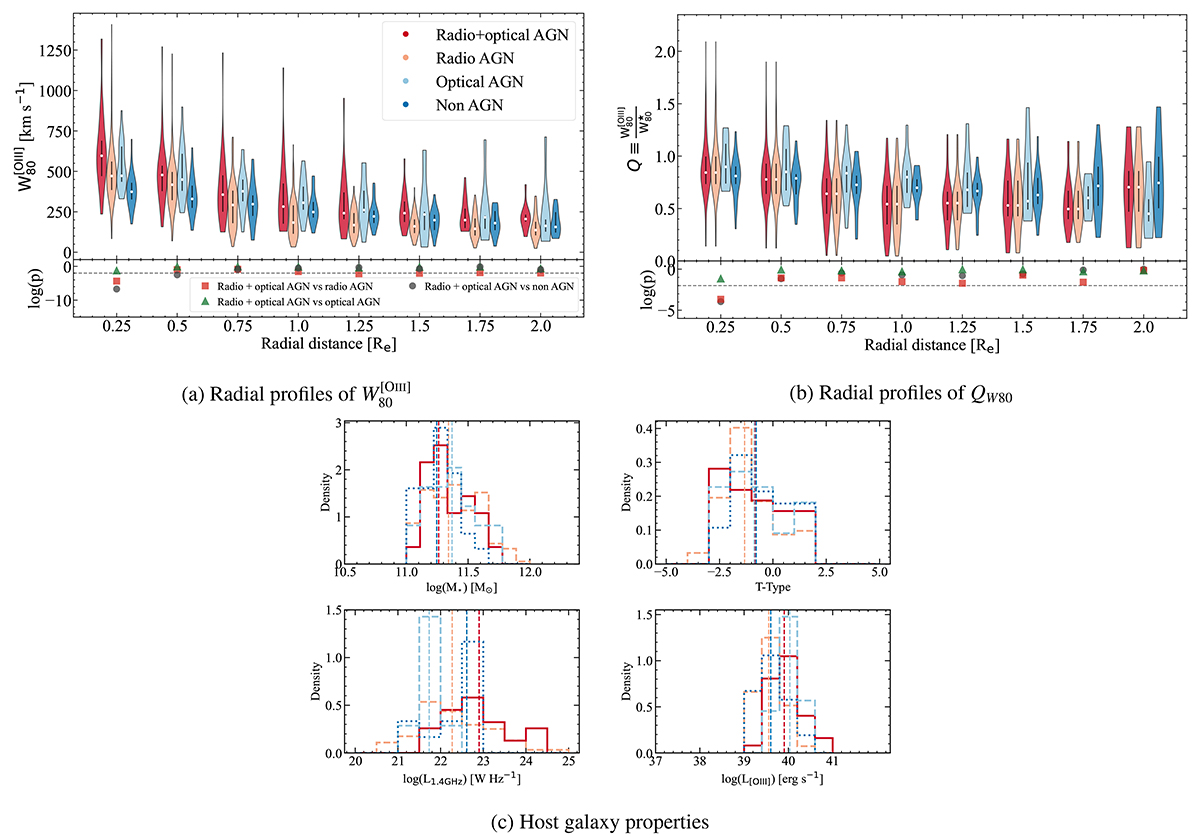
Comparison of the four groups with: an optical and radio-AGN, radio-AGN, optical-AGN, and non-AGN. Radial profiles of ![]() (a) and QW80 (b) values, in steps of 0.25 Reff. The violin plots show the distributions for every group at every radial point, with the white circle showing the median values and the black lines showing the range from the 25th to 75th percentile of the distributions. The bottom panel shows the p-values for a two-sample KS test at every radial point, with the two sample combinations marked in the legend. The horizontal dashed line marks the 99% confidence level p-value. (c) Host galaxy properties of the source groups, showing the stellar mass, host galaxy T-type, radio luminosity, and [O III] luminosity. Vertical lines show the median values. The colours represent the same sources as in the top panels. All source luminosities are only for radio and [O III] detections.
(a) and QW80 (b) values, in steps of 0.25 Reff. The violin plots show the distributions for every group at every radial point, with the white circle showing the median values and the black lines showing the range from the 25th to 75th percentile of the distributions. The bottom panel shows the p-values for a two-sample KS test at every radial point, with the two sample combinations marked in the legend. The horizontal dashed line marks the 99% confidence level p-value. (c) Host galaxy properties of the source groups, showing the stellar mass, host galaxy T-type, radio luminosity, and [O III] luminosity. Vertical lines show the median values. The colours represent the same sources as in the top panels. All source luminosities are only for radio and [O III] detections.
Current usage metrics show cumulative count of Article Views (full-text article views including HTML views, PDF and ePub downloads, according to the available data) and Abstracts Views on Vision4Press platform.
Data correspond to usage on the plateform after 2015. The current usage metrics is available 48-96 hours after online publication and is updated daily on week days.
Initial download of the metrics may take a while.