Fig. 3.
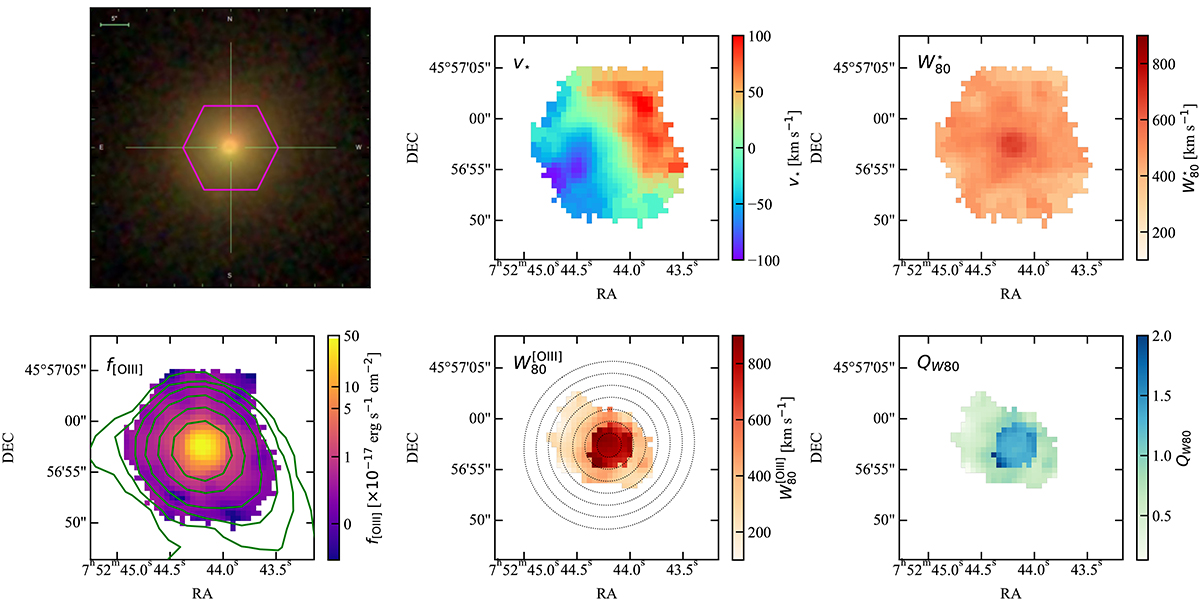
Download original image
Maps of a radio-AGN from the sample (plateifu = 8714−3704). The top left image shows the SDSS optical colour image of the host galaxy, with the MaNGA FoV marked with magenta. The other panels show the stellar and [O III] emission line properties. Only spaxels with a [O III] detection of S/N > 5 are shown and used throughout the paper for analysis. The green contours show the radio emission from FIRST at 1.4 GHz in the bottom left panel. The elliptical annuli regions used for constructing radial profiles are shown in the bottom middle panel. The same plot for a non-AGN source is shown in Fig. A.2 to illustrate the differences in their gas kinematics.
Current usage metrics show cumulative count of Article Views (full-text article views including HTML views, PDF and ePub downloads, according to the available data) and Abstracts Views on Vision4Press platform.
Data correspond to usage on the plateform after 2015. The current usage metrics is available 48-96 hours after online publication and is updated daily on week days.
Initial download of the metrics may take a while.