Fig. 2.
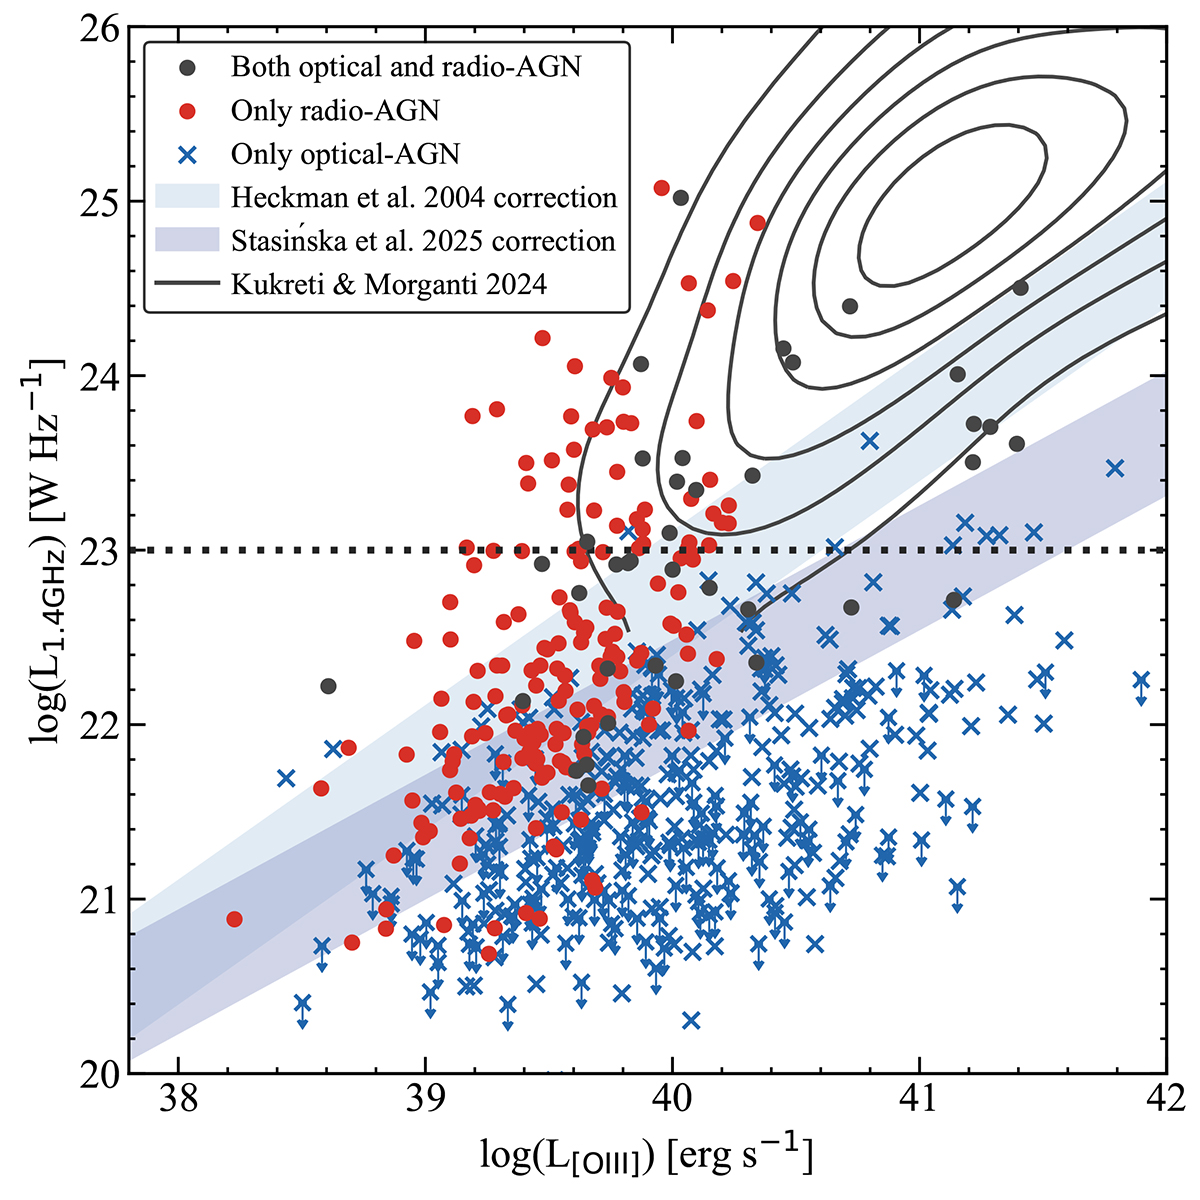
Download original image
1.4 GHz and [O III] luminosities of the sources with an [O III] detection. Sources with radio+optical AGN, radio-AGN, and optical-AGN are shown. For optical-AGN without a radio detection, the arrows show the upper limits on L1.4 GHz. The shaded regions show the expected radio luminosity from the shocks scenario using the Nims et al. (2015) model, where the lower and upper edges show the limits for 5% and 25% coupling efficiency between AGN luminosity and wind kinetic luminosity, respectively. Different regions show the [O III] to bolometric luminosity conversion factors from Heckman et al. (2004) and Stasińska et al. (2025). The horizontal dotted lines show the luminosity divisions used in Sect. 4. To highlight the low-to-moderate luminosity nature of the sources in our study, we also show the parameter space occupied by the radio-AGN sample from Kukreti & Morganti (2024) in black contours, which examines the relation between radio properties and feedback on [O III] out to z = 0.8.
Current usage metrics show cumulative count of Article Views (full-text article views including HTML views, PDF and ePub downloads, according to the available data) and Abstracts Views on Vision4Press platform.
Data correspond to usage on the plateform after 2015. The current usage metrics is available 48-96 hours after online publication and is updated daily on week days.
Initial download of the metrics may take a while.