Fig. 1.
Download original image
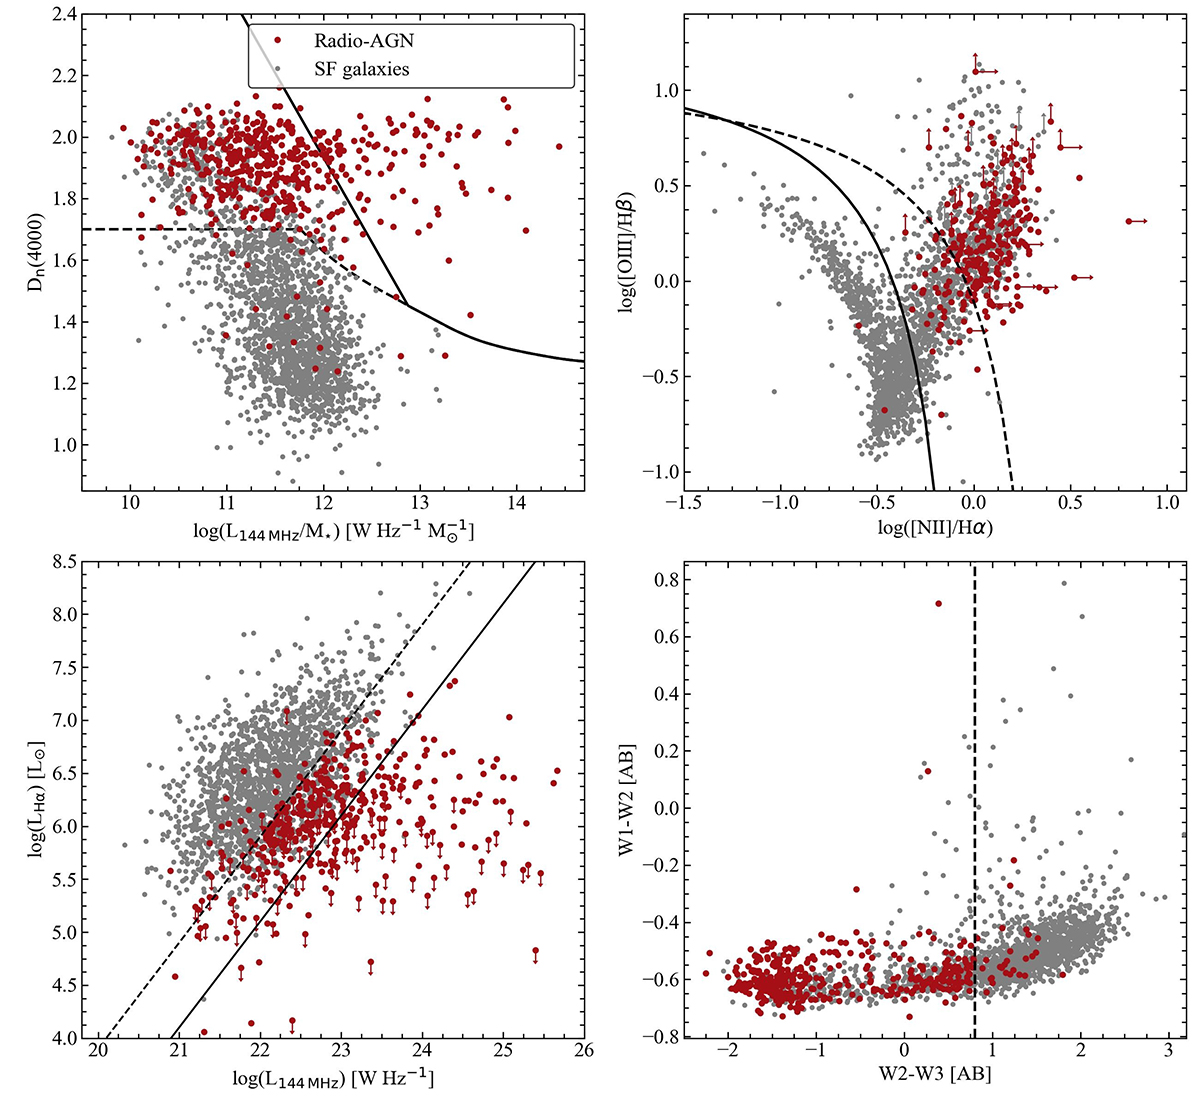
Diagnostic plots for selecting radio-AGN using LoTSS data. Red points mark the sources classified as radio-AGN after combining all four diagnostics, and grey points show the star-forming/radio-quiet AGN: (a) Dn(4000) vs L1.4 GHz/M⋆ plot. The solid and dashed curves mark the radio-AGN, intermediate and SF/RQAGN division from Best & Heckman (2012) and Sabater et al. (2019); (b) LHα versus L1.4 GHz plot, with the separation lines from Sabater et al. (2019); (c) BPT diagram where the solid curve shows the semi-empirical relation from Kauffmann et al. (2003), and the dashed curve shows the maximum starburst curve from Kewley et al. (2006); (d) WISE colour-colour plot for sources with the division line from Sabater et al. (2019).
Current usage metrics show cumulative count of Article Views (full-text article views including HTML views, PDF and ePub downloads, according to the available data) and Abstracts Views on Vision4Press platform.
Data correspond to usage on the plateform after 2015. The current usage metrics is available 48-96 hours after online publication and is updated daily on week days.
Initial download of the metrics may take a while.