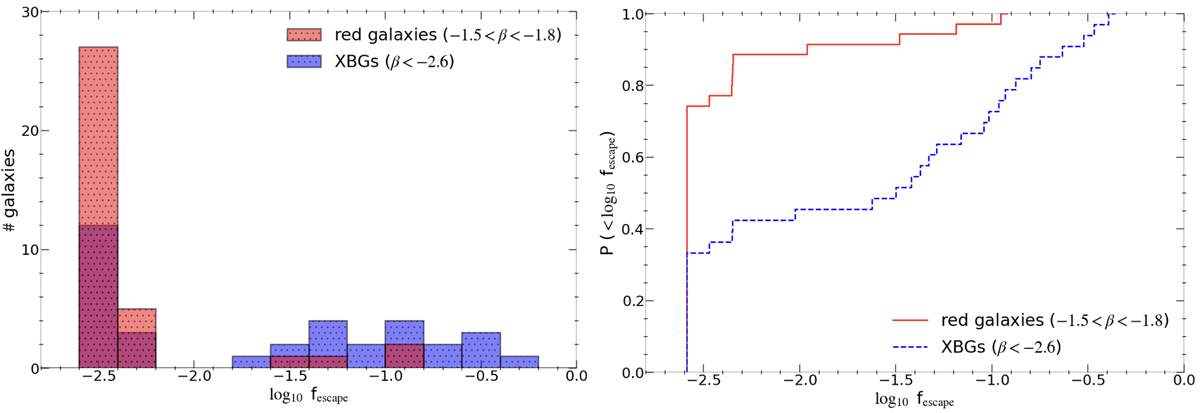
Fig. 7.
Download original image
Left: Histogram distribution of the escape fractions (estimated indirectly, as explained in the text, and in logarithmic scale) for the subsets of XBGs (blue bars) and red galaxies (red bars), matched in redshift and MUV to the XBGs. Right: Cumulative distribution functions of log10fesc for XBGs and red galaxies (blue dashed and red solid line, respectively).
Current usage metrics show cumulative count of Article Views (full-text article views including HTML views, PDF and ePub downloads, according to the available data) and Abstracts Views on Vision4Press platform.
Data correspond to usage on the plateform after 2015. The current usage metrics is available 48-96 hours after online publication and is updated daily on week days.
Initial download of the metrics may take a while.