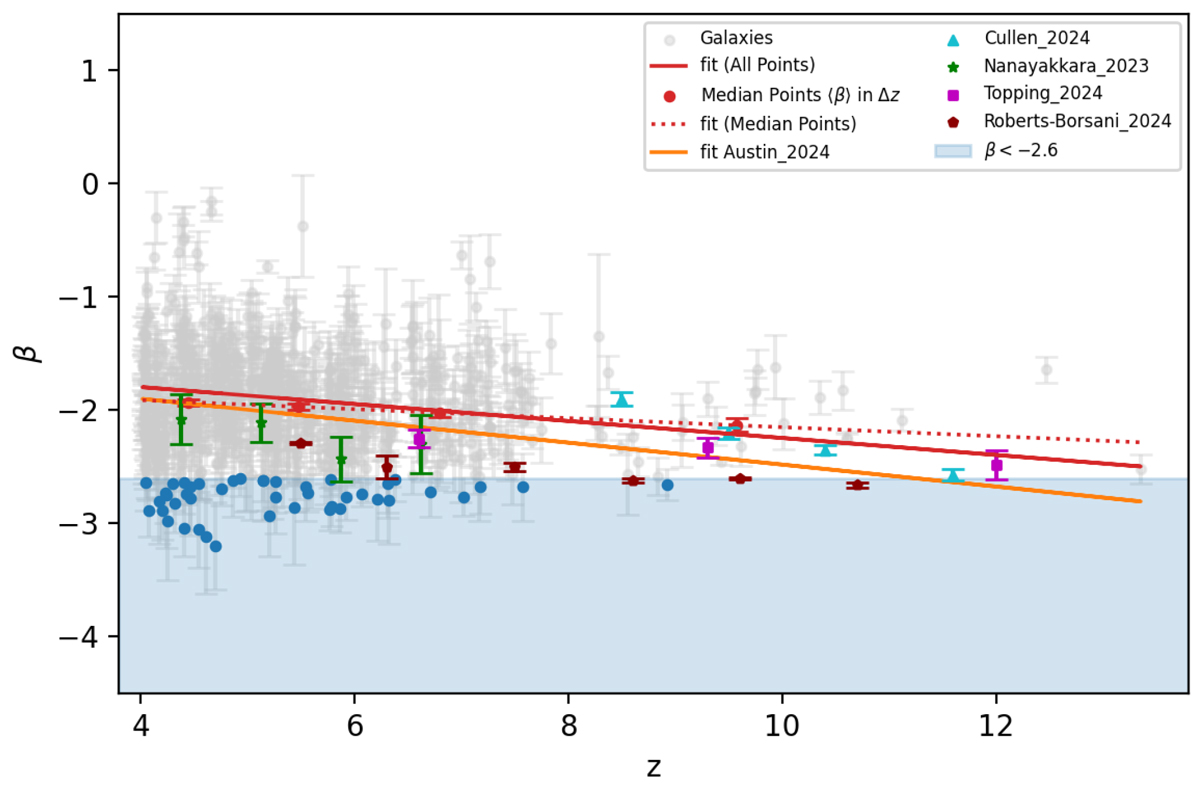
Fig. 3.
Download original image
Redshift evolution of the spectroscopic β from z = 4 to z = 14. The best-fit linear relation of all the individual galaxies (gray points) is shown with a red solid line, while the best-fit to the medium points in the redshift bins (red circles) is displayed with a red dashed line. Average UV slopes from the literature are also shown for comparison. The blue points are the XBGs studied in Sect. 4.
Current usage metrics show cumulative count of Article Views (full-text article views including HTML views, PDF and ePub downloads, according to the available data) and Abstracts Views on Vision4Press platform.
Data correspond to usage on the plateform after 2015. The current usage metrics is available 48-96 hours after online publication and is updated daily on week days.
Initial download of the metrics may take a while.