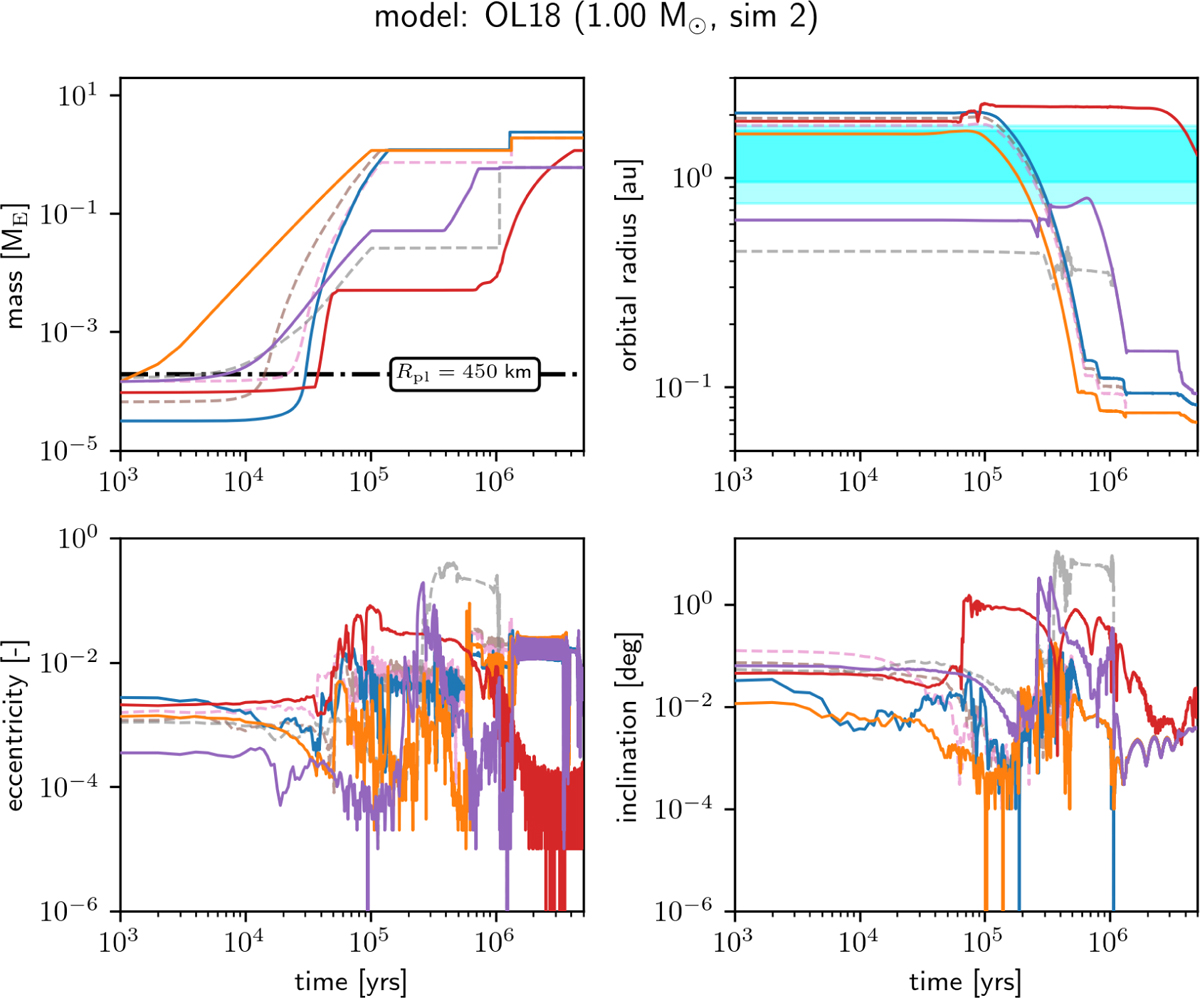
Fig. 7
Download original image
Dynamical evolution tracks (Mp, a, e and i) of all large planets in OL18 simulation 7 around a solar-mass star. The different coloured solid lines represent different planets, the red one being the planet that is currently in the habitable zone (cyan shaded region). The transparent dashed lines represent large planetesimals that merged with the planets. Sudden stepwise increases in planet masses signify these mergers. Only planets with masses >0.1 ME are included; however, for this simulation, there are no other objects with masses of ≳10−3 ME.
Current usage metrics show cumulative count of Article Views (full-text article views including HTML views, PDF and ePub downloads, according to the available data) and Abstracts Views on Vision4Press platform.
Data correspond to usage on the plateform after 2015. The current usage metrics is available 48-96 hours after online publication and is updated daily on week days.
Initial download of the metrics may take a while.