Fig. 6
Download original image
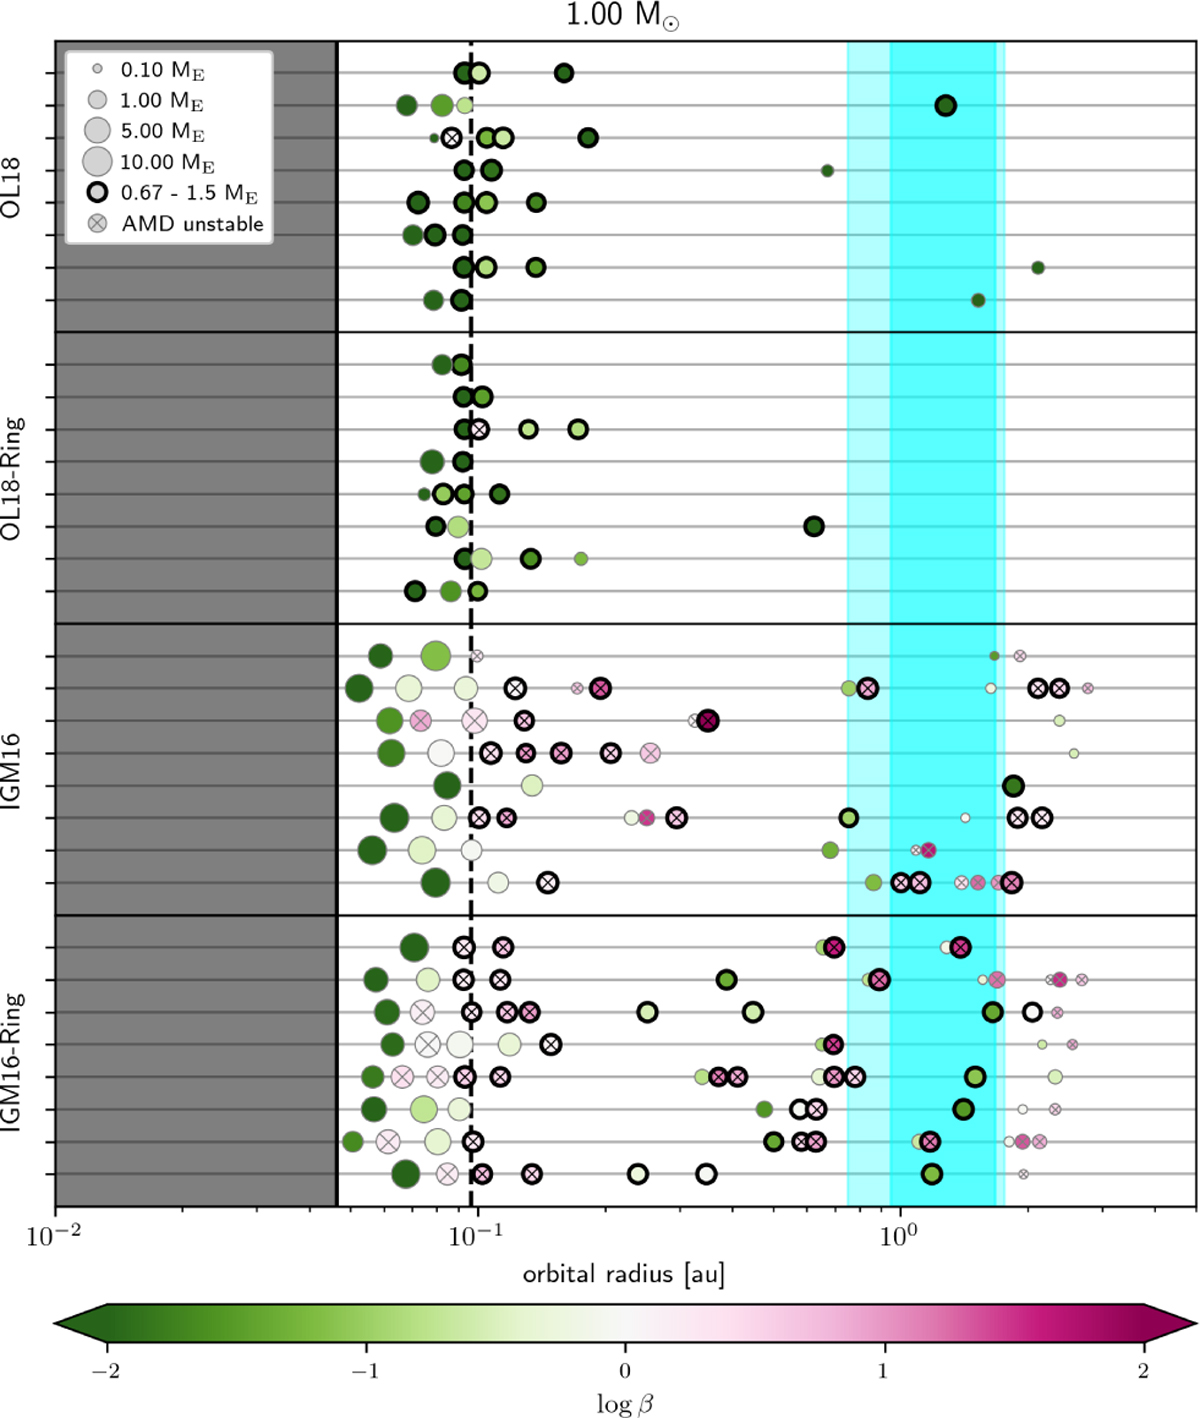
Simulated planetary systems around a 1.00 M⊙ star for the four PA models. The size of the markers represents the mass of the planet. The simulations are grouped by their model, and each horizontal line represents a simulation. The vertical dashed line at ~10−1 au is the inner radius of the gas disc, within which the gas density rapidly drops and type I and type II migration halts. Any planet that enters the gray region, interior to the inner truncation radius, is removed from the simulation. The cyan shaded regions represent the conservative (darker shaded) and optimistic (lighter shaded) habitable zone. The colour of the planets indicates their AMD stability, discussed in Sect. 5.6. Only planets more massive than Mars are shown.
Current usage metrics show cumulative count of Article Views (full-text article views including HTML views, PDF and ePub downloads, according to the available data) and Abstracts Views on Vision4Press platform.
Data correspond to usage on the plateform after 2015. The current usage metrics is available 48-96 hours after online publication and is updated daily on week days.
Initial download of the metrics may take a while.