Open Access
Fig. 11
Download original image
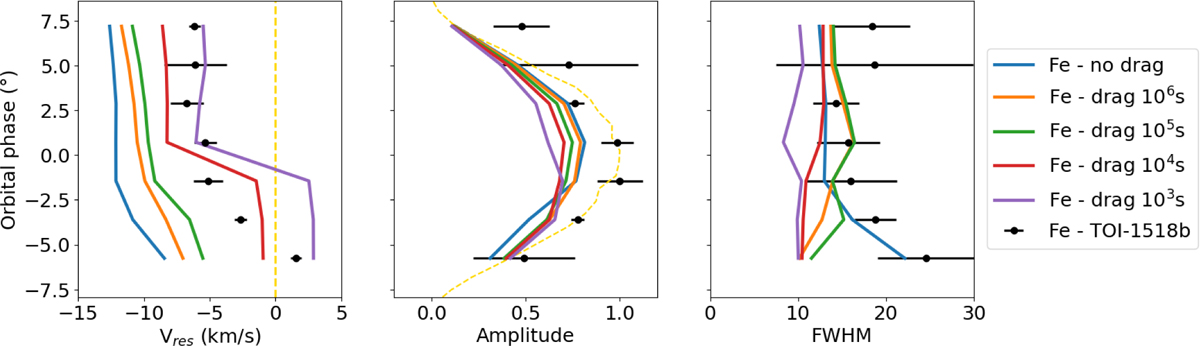
Same as Fig. 6, but with results of Gaussian fit for different models from “no drag effect” to “strong drag effect”. In the central panel, the illuminated fraction of the planetary limb as a function of the orbital phase is represented by a dashed yellow line.
Current usage metrics show cumulative count of Article Views (full-text article views including HTML views, PDF and ePub downloads, according to the available data) and Abstracts Views on Vision4Press platform.
Data correspond to usage on the plateform after 2015. The current usage metrics is available 48-96 hours after online publication and is updated daily on week days.
Initial download of the metrics may take a while.