Fig. 10
Download original image
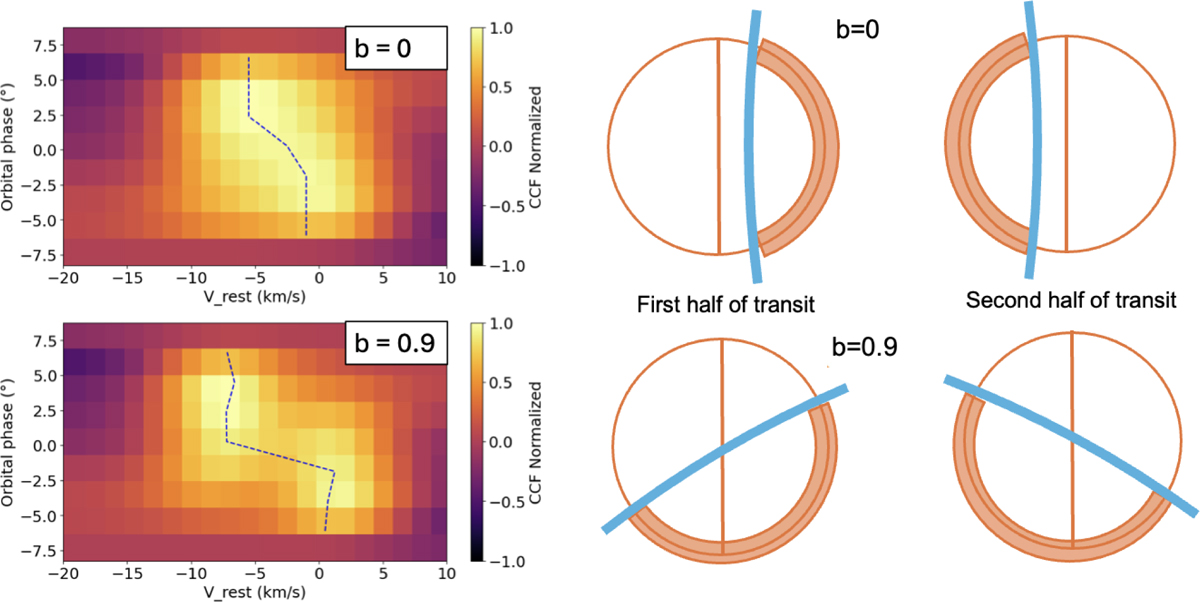
Importance of impact parameter b with examples for b=0 on the top row and b =0.9 on the lower row. On the left, the CCF maps of the injected models within blue dashed lines and the Gaussian fit applied similarly to the data (Fig. 6). On the right, the illuminated part of the limb during the first and second half of the transit is represented in a vertical slice and shown to scale.
Current usage metrics show cumulative count of Article Views (full-text article views including HTML views, PDF and ePub downloads, according to the available data) and Abstracts Views on Vision4Press platform.
Data correspond to usage on the plateform after 2015. The current usage metrics is available 48-96 hours after online publication and is updated daily on week days.
Initial download of the metrics may take a while.