Fig. 9.
Download original image
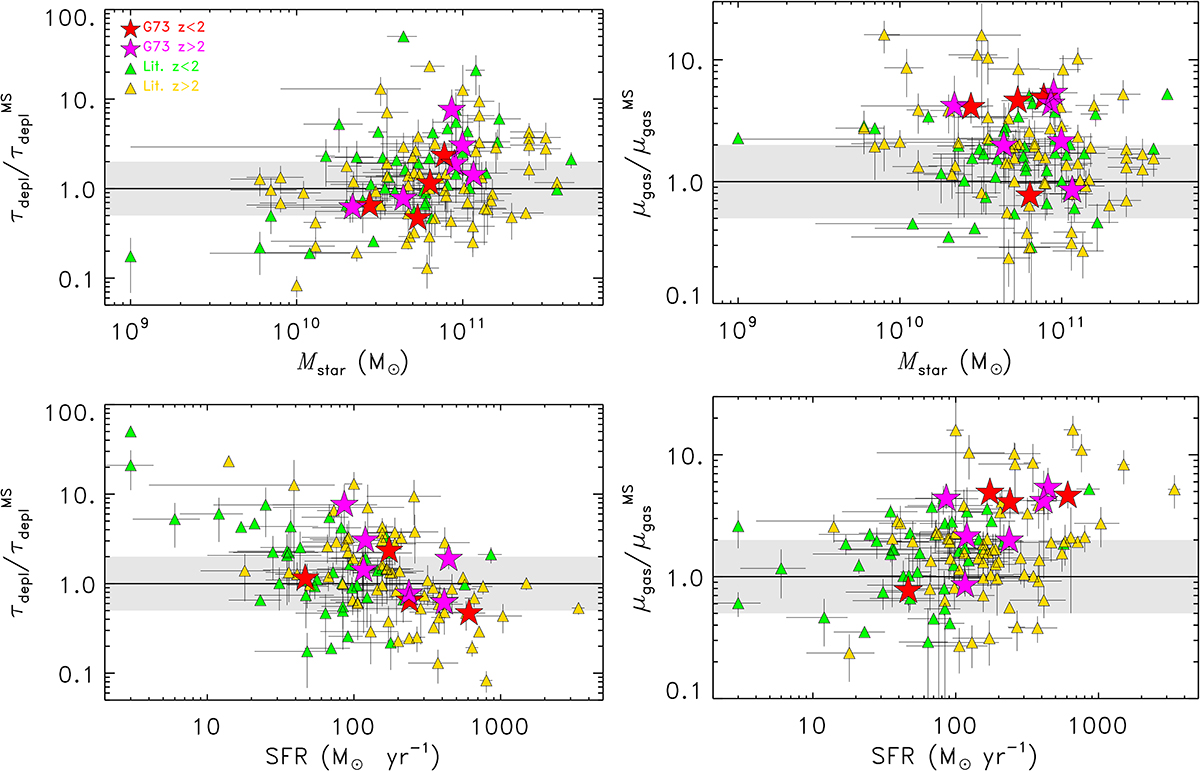
Gas depletion timescales (left) and gas-to-stellar mass ratios (right) of cluster galaxies relative to the predicted gas properties as a function of stellar mass (top) and of SFR (bottom). The predicted properties are estimated for each individual source given its redshift and stellar mass assuming the scaling relations derived for field galaxies by Liu et al. (2019). Symbols are as in Fig. 6. The solid black line represents the Liu et al. (2019) scaling relation for τdepl and μgas = Mgas/Mstar with a scatter of 0.3 dex (grey shaded regions). About half of the CO-emitters in this work is characterized by higher gas-to-stellar mass ratios, which is also seen in the other cluster samples. On the other hand, most of the galaxies in G073 have depletion times consistent with the field.
Current usage metrics show cumulative count of Article Views (full-text article views including HTML views, PDF and ePub downloads, according to the available data) and Abstracts Views on Vision4Press platform.
Data correspond to usage on the plateform after 2015. The current usage metrics is available 48-96 hours after online publication and is updated daily on week days.
Initial download of the metrics may take a while.