Fig. 8.
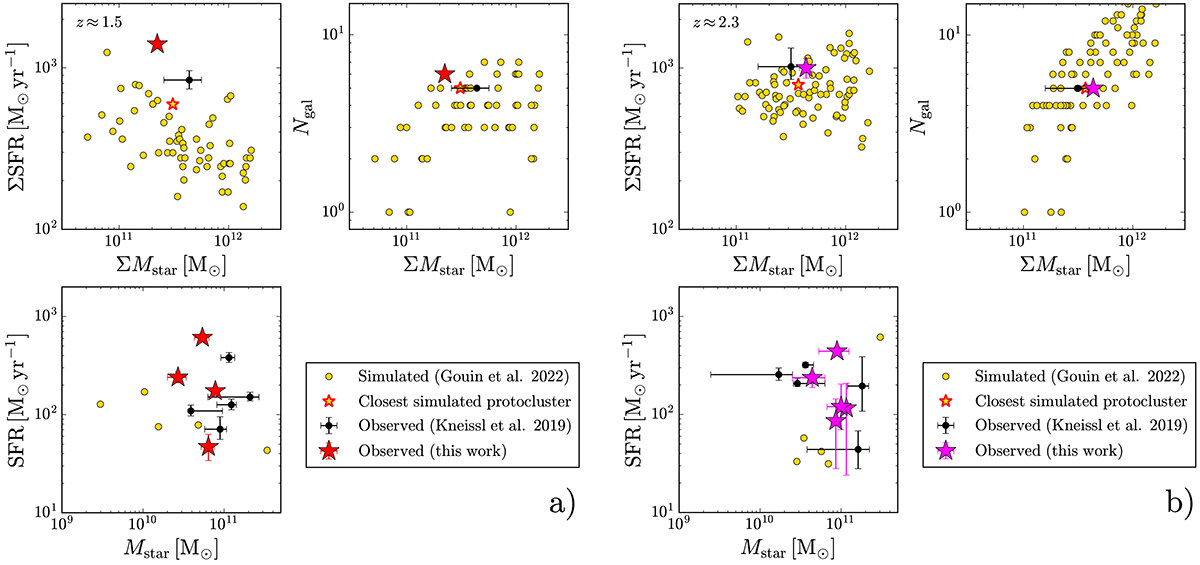
Download original image
Comparison of our results to the TNG300 simulation (Gouin et al. 2022) at (a) z ≈ 1.5 and (b) z ≈ 2.3. Top left in both panels: Total protocluster SFR versus stellar mass for 30 simulated protoclusters (yellow points), compared to previous observations based primarily on photometric redshifts (black point; Kneissl et al. 2019) and our new observations based only on spectroscopic redshifts (red stars). The closest matching simulated halo selected by Gouin et al. (2022) is highlighted in red. Top right in both panels: Same as previous panel but showing the total number of protocluster galaxies with SFR> 10 M⊙ yr−1 versus stellar mass. Bottom in both panels: SFR versus stellar mass for the individual galaxies in the closest-matching simulated halo (yellow points), compared to previous observations (Kneissl et al. 2019) and this work.
Current usage metrics show cumulative count of Article Views (full-text article views including HTML views, PDF and ePub downloads, according to the available data) and Abstracts Views on Vision4Press platform.
Data correspond to usage on the plateform after 2015. The current usage metrics is available 48-96 hours after online publication and is updated daily on week days.
Initial download of the metrics may take a while.