Fig. 3.
Download original image
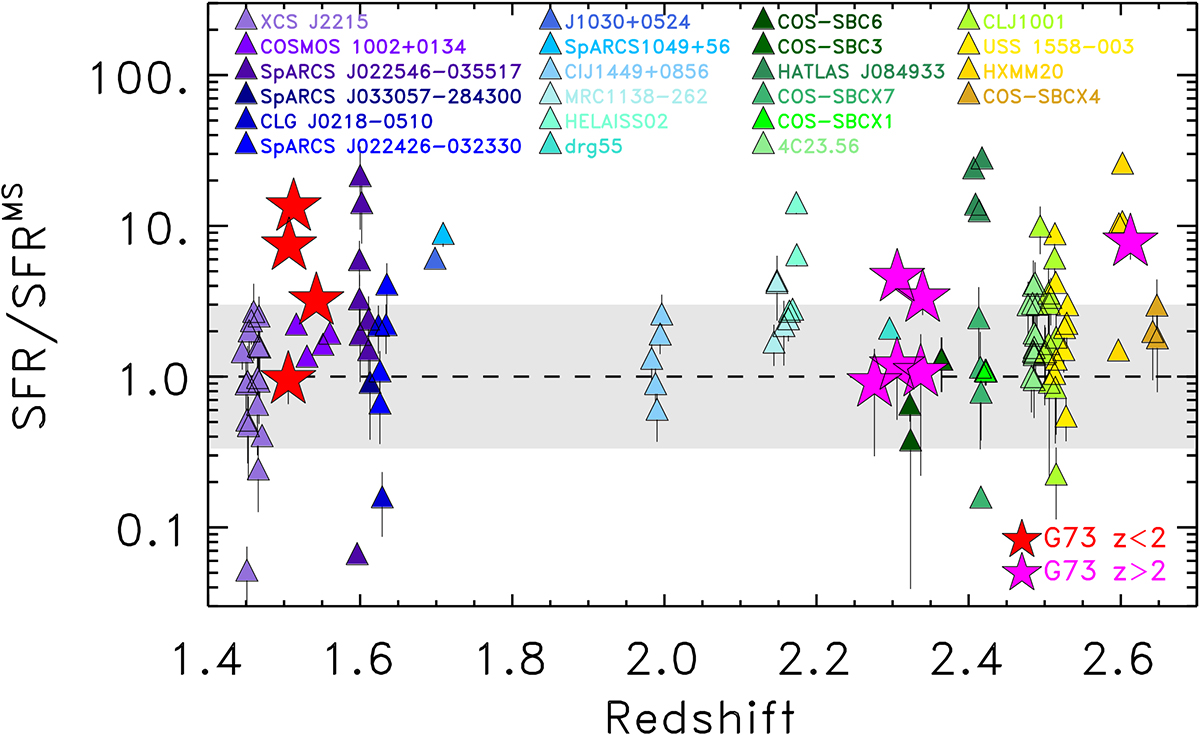
Offset from the MS of star formation (Popesso et al. 2023) as a function of redshift. The grey region represents 0.5 dex scatter around the MS. Filled stars show the CO-emitters in G073 with a stellar mass estimate (red are those with z < 2 and magenta those with z > 2). Coloured triangles represent CO-detected cluster and protocluster members from the literature at 1.4 < z < 2.65: XCS J2215 at z = 1.46 from Hayashi et al. (2018); COSMOS 1002+0134 at z = 1.55 from Aravena et al. (2012); SpARCS J022546−035517 at z = 1.59 from Noble et al. (2019); SpARCS J033057−284300 at z = 1.613 from Noble et al. (2017); CLG J0218−0510 at z = 1.613 from Rudnick et al. (2017); SpARCS J022426−032330 at z = 1.613 from Noble et al. (2017); J1030+0524 at z = 1.694 from D’Amato et al. (2020, 2021); SpARCS1049+56 at z = 1.710 from Webb et al. (2015); ClJ1449+0856 at z = 1.990 from Coogan et al. (2018); MRC1138−262 at z = 2.160 from Dannerbauer et al. (2017), Tadaki et al. (2019); HELAISS02 at z = 2.171 from Gómez-Guijarro et al. (2019); DRG55 at z = 2.290 from Chapman et al. (2015); COS−SBC6 at z = 2.323; COS−SBC3 at z = 2.365 from Sillassen et al. (2024); HATLAS J084933 at z = 2.410 from Ivison et al. (2013); COS−SBCX7 at z = 2.415; COS−SBCX1 at z = 2.422 from Sillassen et al. (2024); 4C23.56 at z = 2.490 from Tadaki et al. (2019), Lee et al. (2017); CLJ1001 at z = 2.510 from Wang et al. (2018); USS 1558−003 at z = 2.530 from Tadaki et al. (2014, 2019); HXMM20 at z = 2.602 from Gómez-Guijarro et al. (2019); COS−SBCX4 at z = 2.646 from Sillassen et al. (2024).
Current usage metrics show cumulative count of Article Views (full-text article views including HTML views, PDF and ePub downloads, according to the available data) and Abstracts Views on Vision4Press platform.
Data correspond to usage on the plateform after 2015. The current usage metrics is available 48-96 hours after online publication and is updated daily on week days.
Initial download of the metrics may take a while.