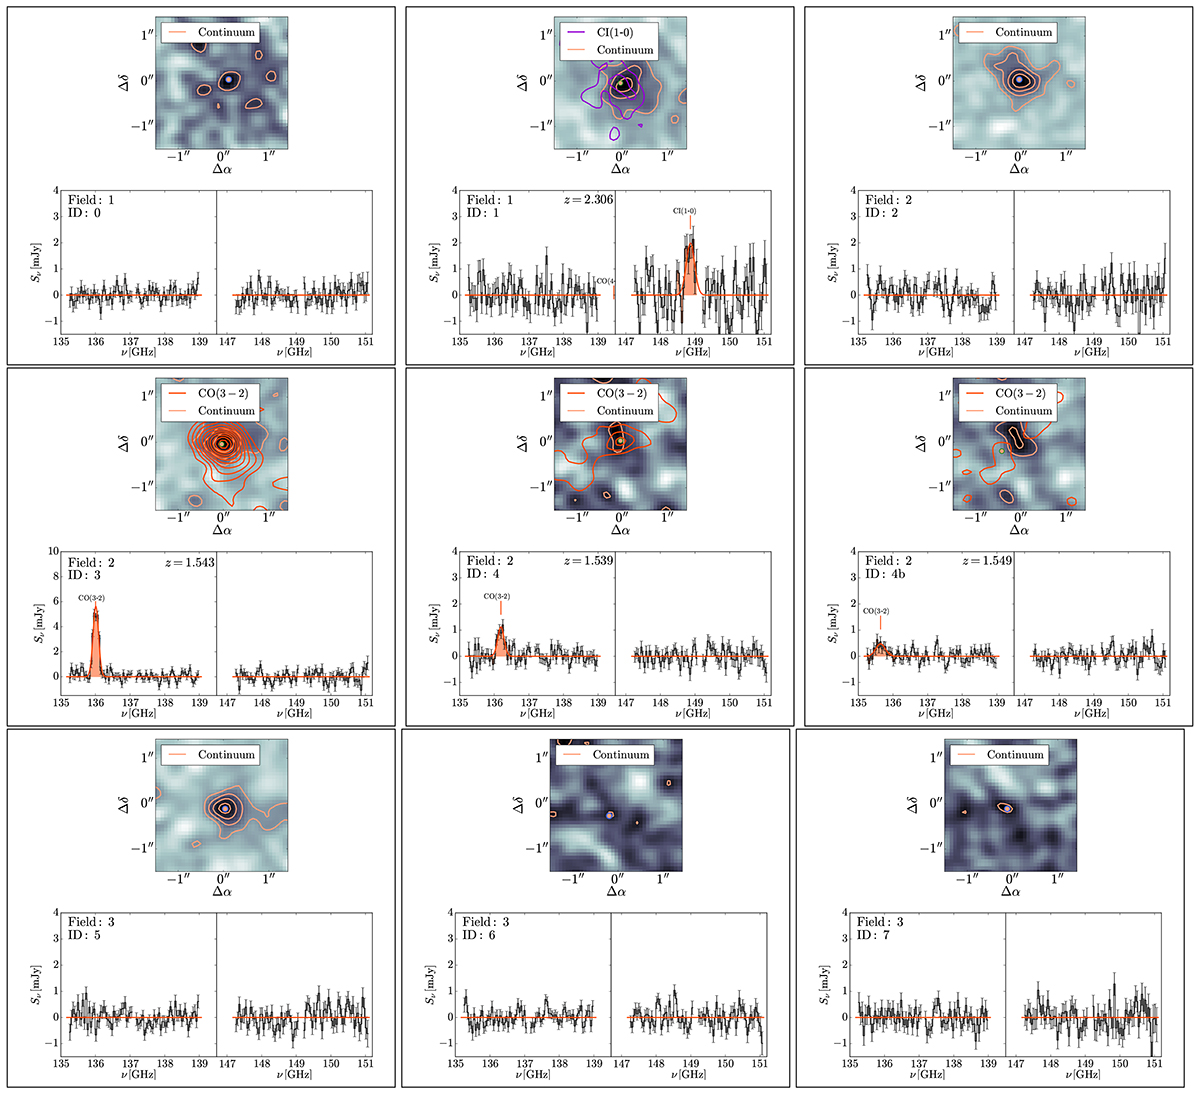
Fig. A.1.

Download original image
ALMA Band 4 cutouts and spectra for all sources in G073. The upper panels show 3″ × 3″cutouts, with continuum images in the background highlighted by orange contours starting at 2σ and increasing in steps of 3σ. For sources with line detections, moment-0 contours (red) are overlaid following the same steps. The lower panels show the continuum-subtracted LSB and USB spectra, with the best-fitting Gaussian functions plotted over the raw data and the shaded regions indicating the integration range used to measure the line strengths.
Current usage metrics show cumulative count of Article Views (full-text article views including HTML views, PDF and ePub downloads, according to the available data) and Abstracts Views on Vision4Press platform.
Data correspond to usage on the plateform after 2015. The current usage metrics is available 48-96 hours after online publication and is updated daily on week days.
Initial download of the metrics may take a while.


