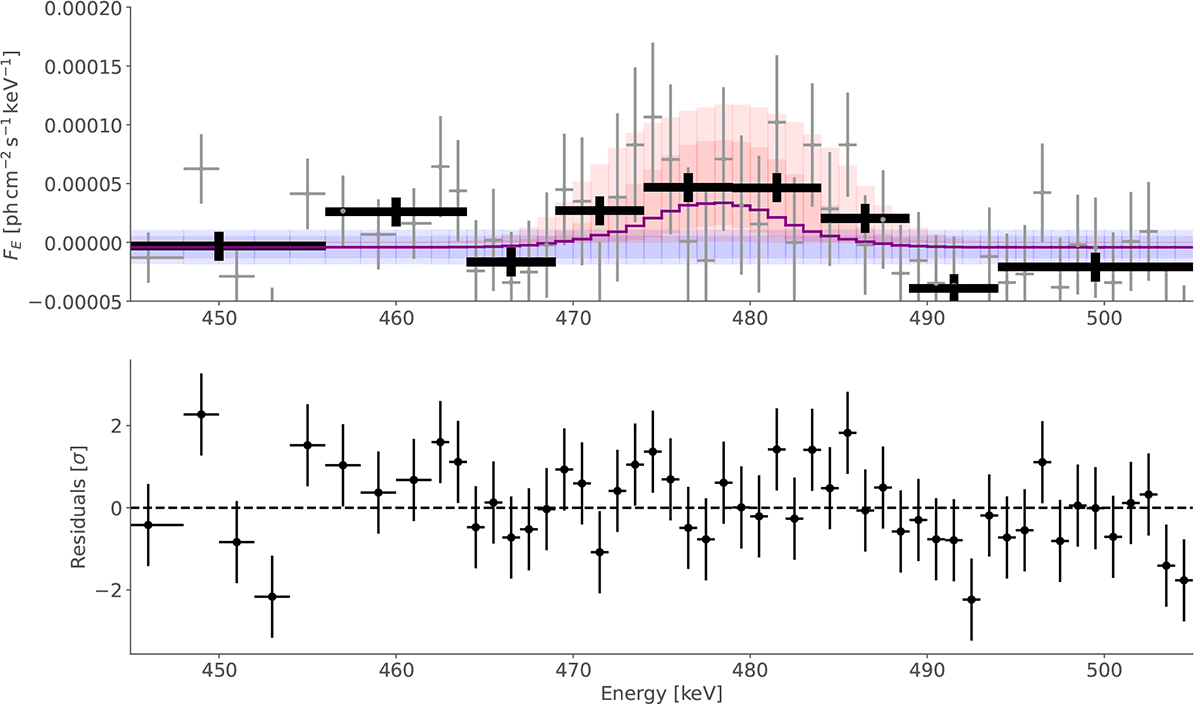
Fig. 6.
Download original image
Detection of the 478 keV line in INTEGRAL/SPI data during revolution 1368, obtained with analysis using a fixed Gaussian line width. Inspection of the full spectrum from 20 keV to 505 keV shows that it is consistent with zero everywhere except for the bump at 478 keV. The top panel shows the extracted fluxes (grey) and re-binned (black). The fitted spectrum is shown as a blue (constant) and red (line) band with their 1 and 2 sigma uncertainties. The bottom panel shows the residuals of the fit for the top panel (the plot for the line with a free line width is very similar).
Current usage metrics show cumulative count of Article Views (full-text article views including HTML views, PDF and ePub downloads, according to the available data) and Abstracts Views on Vision4Press platform.
Data correspond to usage on the plateform after 2015. The current usage metrics is available 48-96 hours after online publication and is updated daily on week days.
Initial download of the metrics may take a while.