Open Access
Fig. 5.
Download original image
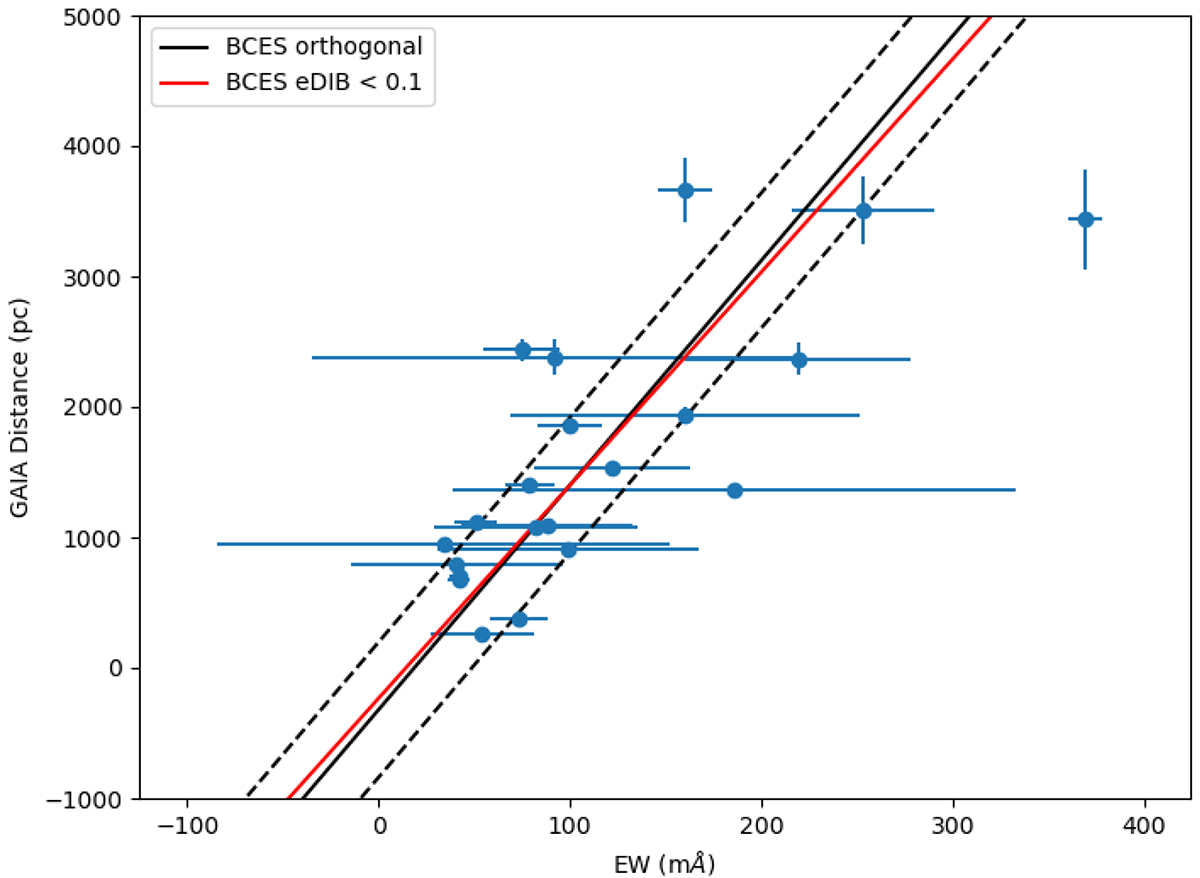
Diffuse interstellar band 862.1 nm EW vs. Gaia distance distribution. The black curve represents the best fit identified from the entire sample of 21 stars, while the red curve refers to the same analysis performed on the stars characterised by an uncertainty on the EW < 100 mÅ.
Current usage metrics show cumulative count of Article Views (full-text article views including HTML views, PDF and ePub downloads, according to the available data) and Abstracts Views on Vision4Press platform.
Data correspond to usage on the plateform after 2015. The current usage metrics is available 48-96 hours after online publication and is updated daily on week days.
Initial download of the metrics may take a while.