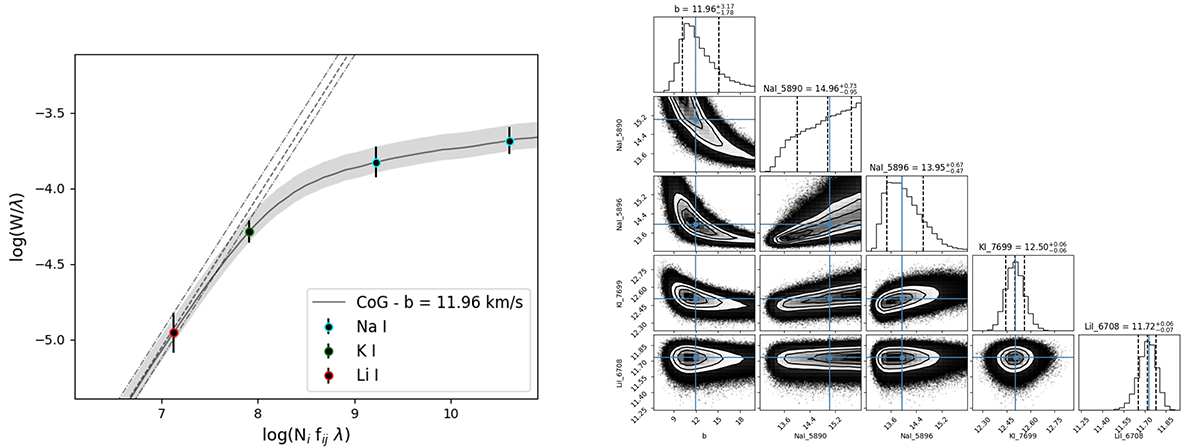
Fig. A.1.
Download original image
(Left panel) The best-fit curve of growth obtained from the equivalent width values measured in the Day 7 spectrum of V1369 Cen. Na I D lines are located in the flat region of the curve of growth, suggesting that they are saturated and hardly usable for precise abundance estimates (see also Fig. A.1). On the other hand, Ki and Li I lines are located in the linear region. This allowed us to estimate the lithium over-abundance and infer the amount of lithium mass in the nova ejecta from the Li I 670.8 nm absorption line. (Right panel) The posterior distribution for the Doppler parameter b and the column densities Ni derived from the MCMC procedure applied to the curve of growth best fit.
Current usage metrics show cumulative count of Article Views (full-text article views including HTML views, PDF and ePub downloads, according to the available data) and Abstracts Views on Vision4Press platform.
Data correspond to usage on the plateform after 2015. The current usage metrics is available 48-96 hours after online publication and is updated daily on week days.
Initial download of the metrics may take a while.