Fig. 11.
Download original image
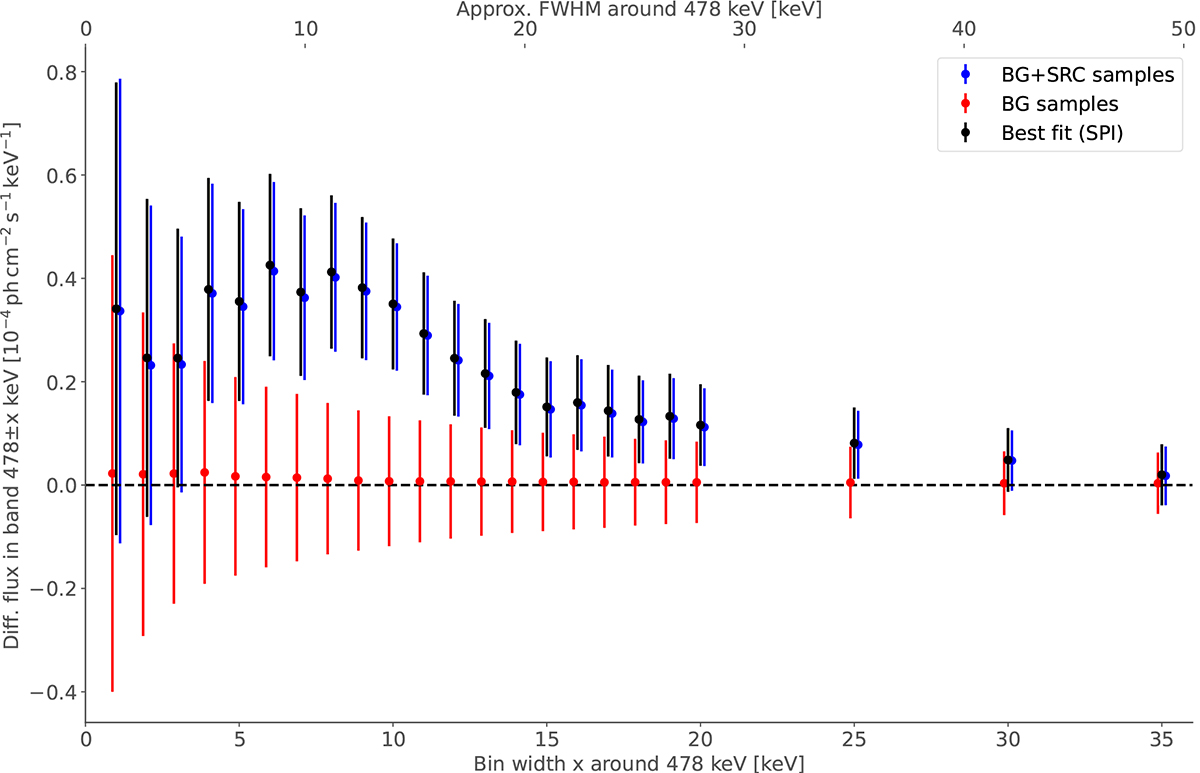
Distribution of differential line fluxes normalised to the different extraction band widths at approximately 478.0 keV. Red data gives the result for the background region alone, while blue data corresponds to an extraction bin centred at 478.0 keV. The variation of the flux for different bin widths, with a maximum reached at about 8 keV, suggests that only for broad line widths, we obtain a significant signal for the line.
Current usage metrics show cumulative count of Article Views (full-text article views including HTML views, PDF and ePub downloads, according to the available data) and Abstracts Views on Vision4Press platform.
Data correspond to usage on the plateform after 2015. The current usage metrics is available 48-96 hours after online publication and is updated daily on week days.
Initial download of the metrics may take a while.