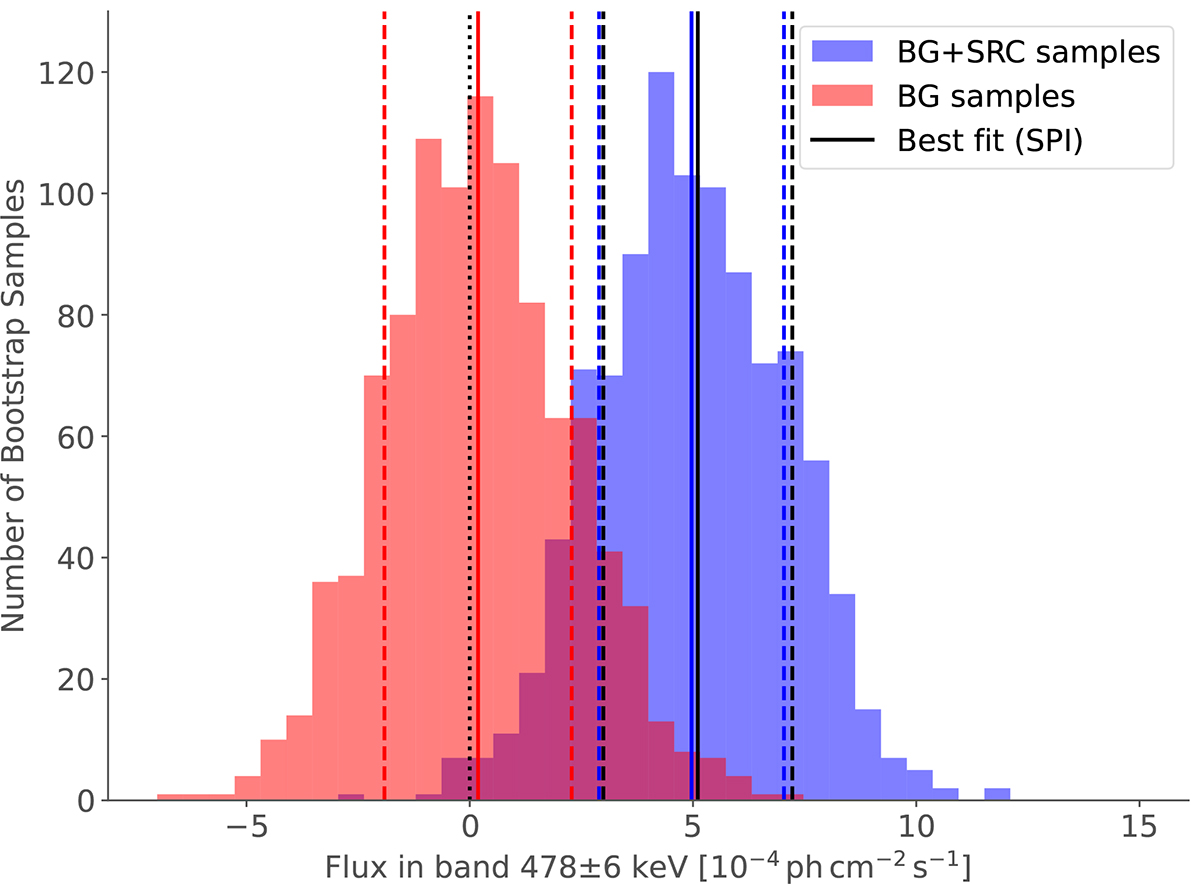
Fig. 10.
Download original image
Results of the bootstrap analysis described in the text. The red histogram represents 1000 resampled bootstrap datasets from the INTEGRAL/SPI containing background data, whereas the blue histogram illustrates samples from a band centred at 478.0 keV with a 12 keV width. Comparing these two distributions reveals an ≈2.5σ significance level for the observed sky flux exceeding the background, indicating a substantial detection of the spectral line.
Current usage metrics show cumulative count of Article Views (full-text article views including HTML views, PDF and ePub downloads, according to the available data) and Abstracts Views on Vision4Press platform.
Data correspond to usage on the plateform after 2015. The current usage metrics is available 48-96 hours after online publication and is updated daily on week days.
Initial download of the metrics may take a while.