Fig. C.1.
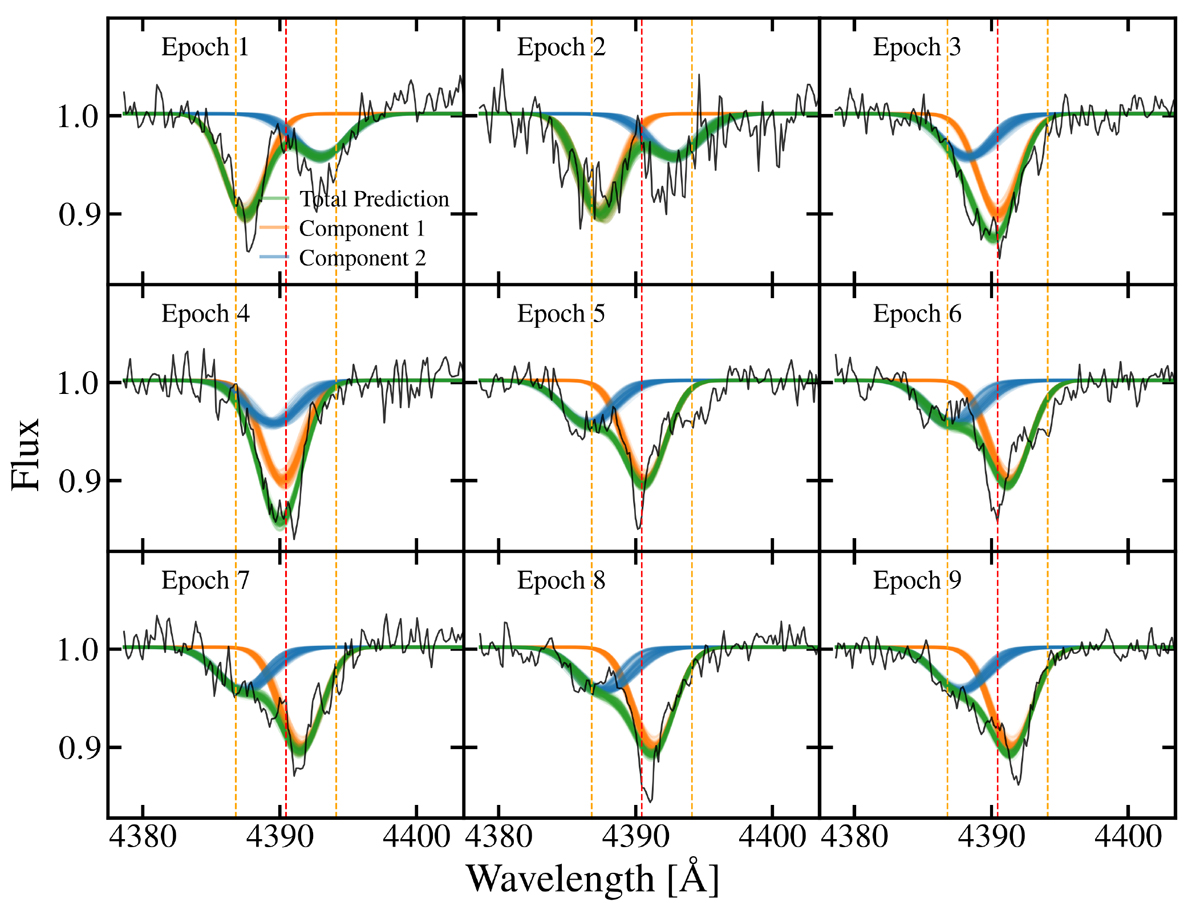
Download original image
Gaussian fitting of the spectral lines He Iλ4388 for the SB3 system BLOeM 5-062. The dashed red line shows the mean SMC velocity of 172 km s−1 (Evans & Howarth 2008), and the dashed orange lines show differences of ±200 km s−1 with respect to the mean velocity. Epoch number increases from left to right and from top to bottom.
Current usage metrics show cumulative count of Article Views (full-text article views including HTML views, PDF and ePub downloads, according to the available data) and Abstracts Views on Vision4Press platform.
Data correspond to usage on the plateform after 2015. The current usage metrics is available 48-96 hours after online publication and is updated daily on week days.
Initial download of the metrics may take a while.