Fig. A.2.
Download original image
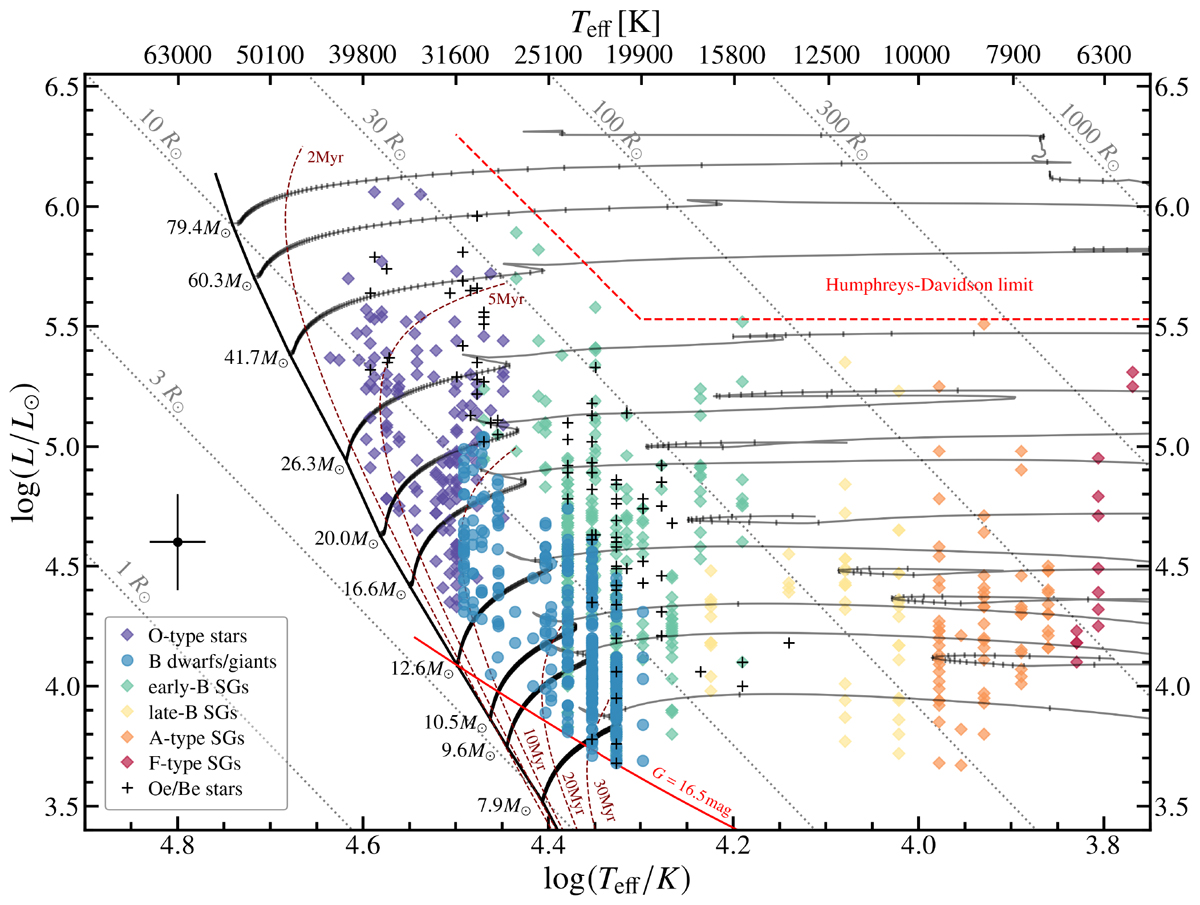
Hertzsprung-Russell diagram of the full BLOeM sample. Stars are colour-coded by spectral type, as indicated in the legend, and Teff and log(L) values are from Bestenlehner et al. (in prep.). The black curves show evolutionary tracks for different initial masses at SMC metallicity from Schootemeijer et al. (2019) with an overshooting prescription from Hastings et al. (2021). Lines of constant radius are marked in grey, and isochrones of different ages are shown with dashed brown curves. The black cross on the left illustrates typical uncertainties in Teff and log(L).
Current usage metrics show cumulative count of Article Views (full-text article views including HTML views, PDF and ePub downloads, according to the available data) and Abstracts Views on Vision4Press platform.
Data correspond to usage on the plateform after 2015. The current usage metrics is available 48-96 hours after online publication and is updated daily on week days.
Initial download of the metrics may take a while.