Fig. 18.
Download original image
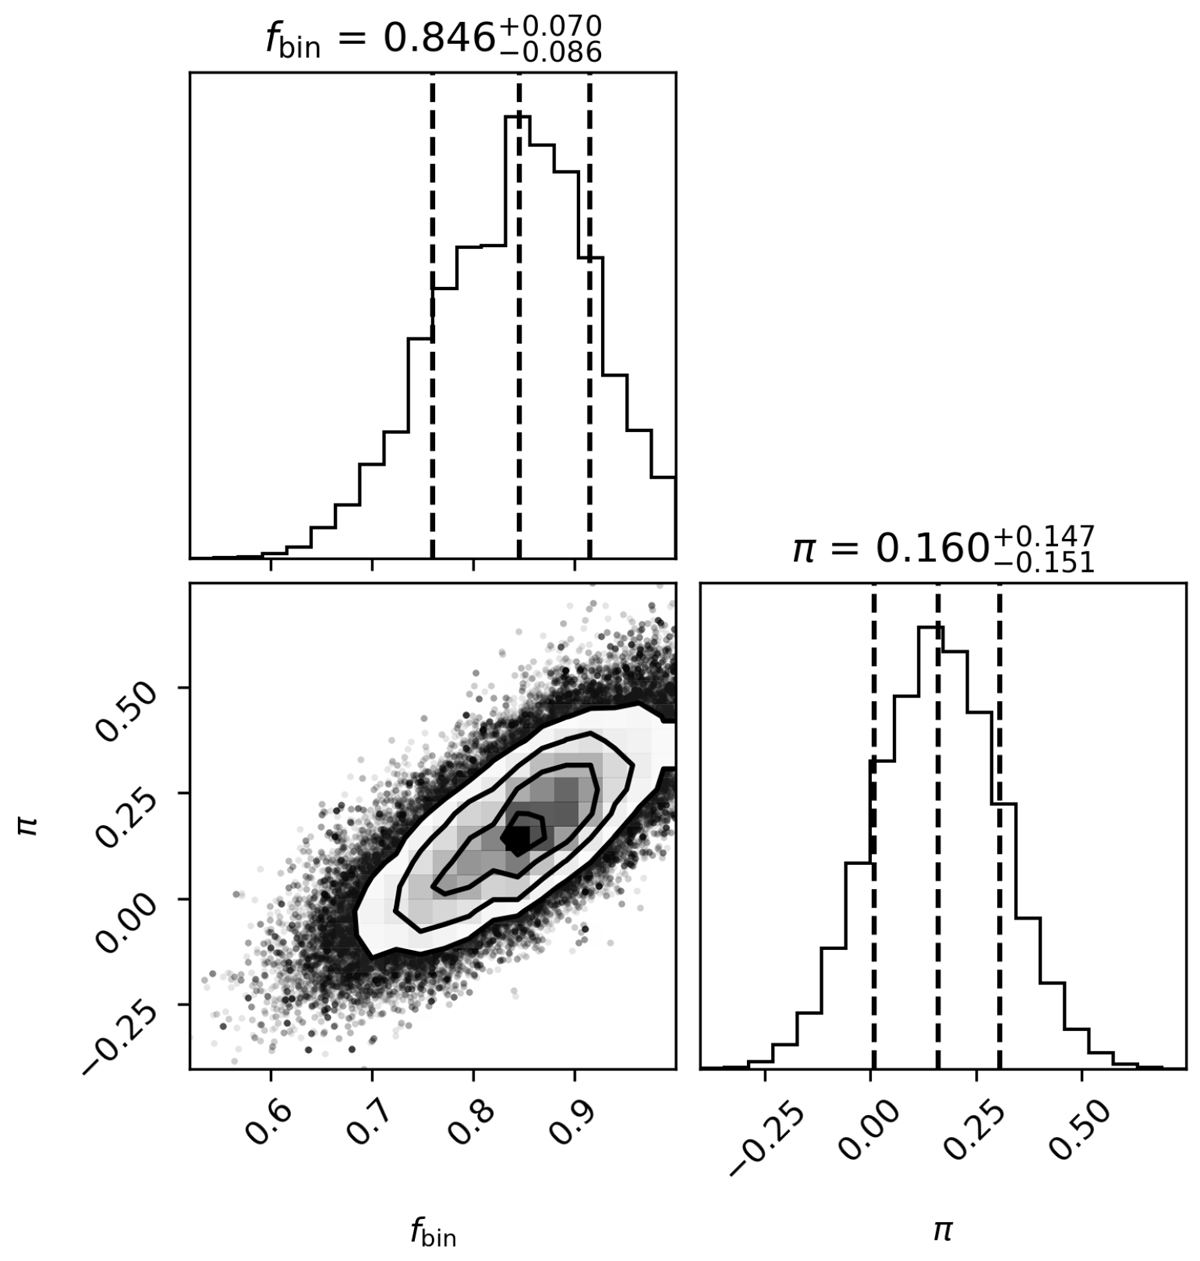
Corner plot illustrating the posterior distribution for the binary fraction (fbin) and period distribution exponent (π). The central (off-diagonal) panel displays the 2D joint posterior density, with contours indicating (2D) 1σ, 2σ, and 3σ confidence levels. The two marginal panels (diagonal) show the 1D distributions for fbin and π, with vertical lines marking the 16%, 50%, and 84% quantiles.
Current usage metrics show cumulative count of Article Views (full-text article views including HTML views, PDF and ePub downloads, according to the available data) and Abstracts Views on Vision4Press platform.
Data correspond to usage on the plateform after 2015. The current usage metrics is available 48-96 hours after online publication and is updated daily on week days.
Initial download of the metrics may take a while.