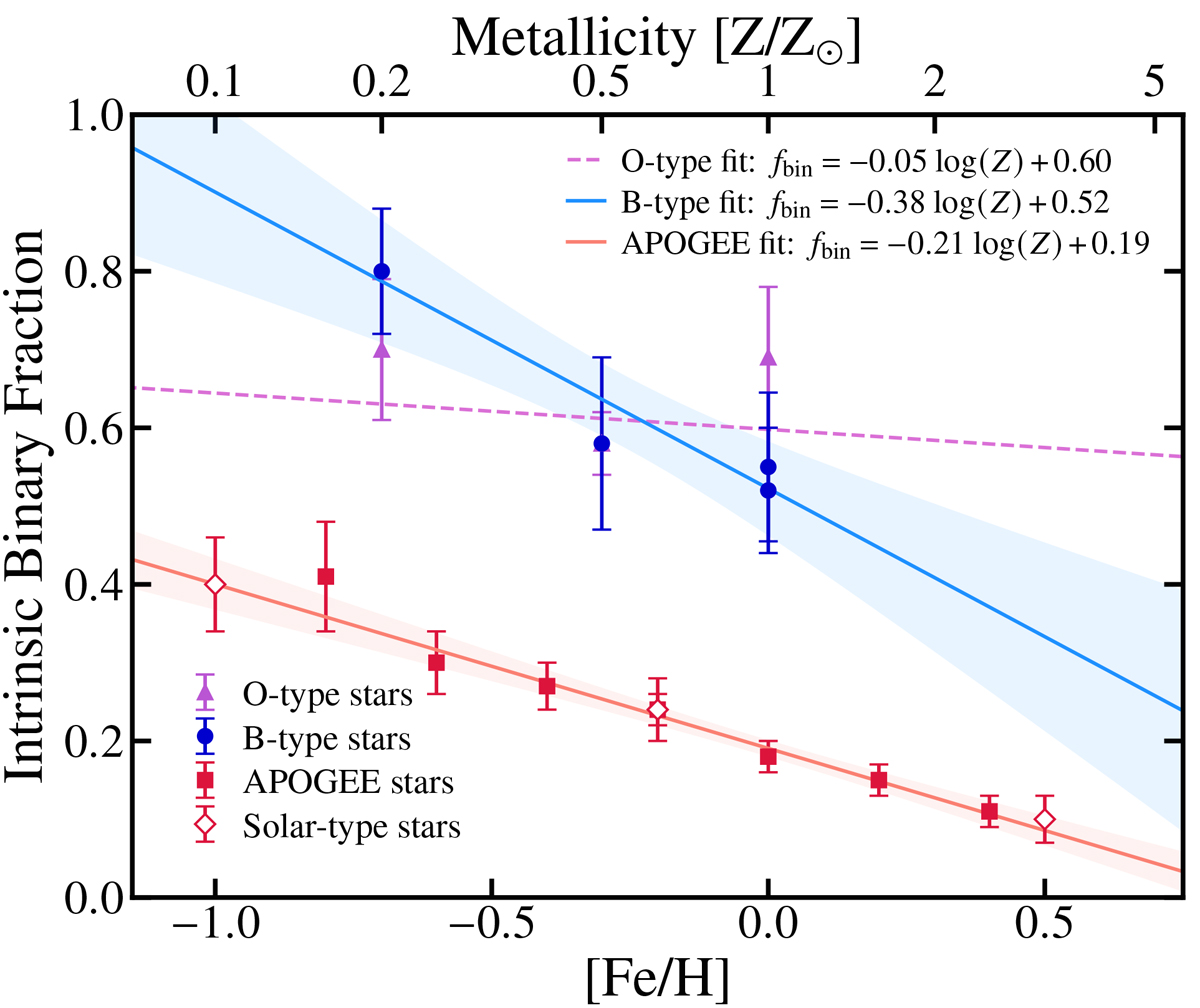
Fig. 14.
Download original image
Dependence of the multiplicity fraction of different mass regimes on metallicity. The B-type studies at different metallicities are represented by blue circles; ZSMC = 0.2 Z⊙ (this work), ZLMC = 0.5 Z⊙ (Dunstall et al. 2015), ZMW = Z⊙ (Kobulnicky et al. 2014; Banyard et al. 2022). The best fit to the data with the 68% confidence interval is represented by the blue line and shaded area. Red squares show the sample of G- and K-type dwarfs from Badenes et al. (2018), whereas red diamonds correspond to the combined data of five solar-type samples presented by Moe et al. (2019), see details in main text. The dashed purple line is the linear regression found by Sana et al. (2025) for the BLOeM O-type stars (purple triangles), included for comparison.
Current usage metrics show cumulative count of Article Views (full-text article views including HTML views, PDF and ePub downloads, according to the available data) and Abstracts Views on Vision4Press platform.
Data correspond to usage on the plateform after 2015. The current usage metrics is available 48-96 hours after online publication and is updated daily on week days.
Initial download of the metrics may take a while.