Fig. 6.
Download original image
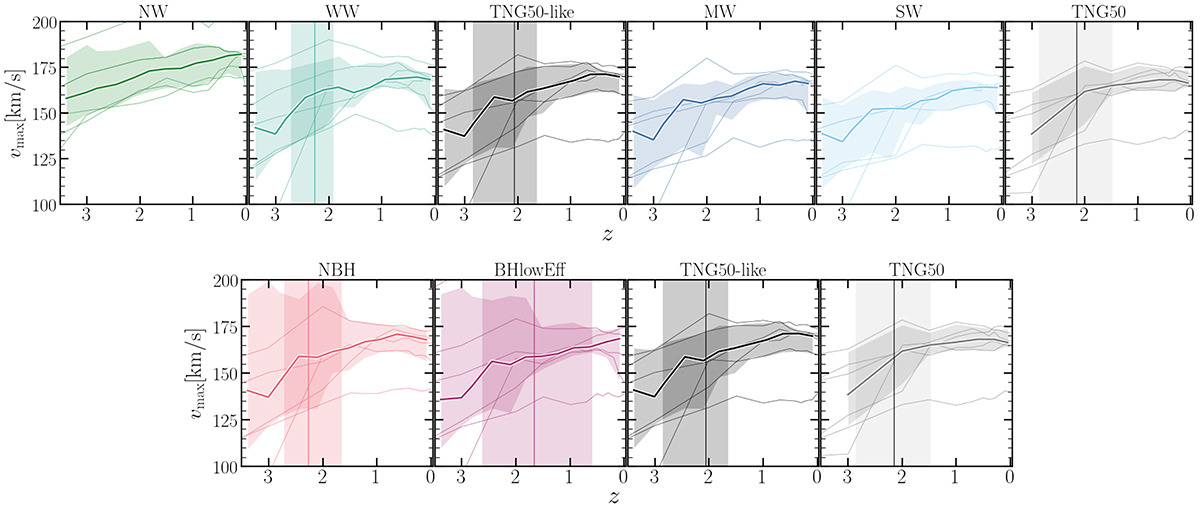
Median evolution of the maximum circular velocity of the dark matter halo. Each column represents the variations of galactic winds (upper Fig.) and BH physics models (bottom Fig.) in order from left to right, and vertical solid lines represent the bar formation redshift. The original galaxy in TNG50 is represented by the final right column. Thinner lines correspond to the evolution of each halo. Vertical solid lines and shaded region represent the median redshift and the distribution between 20th and 80th percentiles of the bar formation time. No significant variation is found in the evolution of vmax among the different models.
Current usage metrics show cumulative count of Article Views (full-text article views including HTML views, PDF and ePub downloads, according to the available data) and Abstracts Views on Vision4Press platform.
Data correspond to usage on the plateform after 2015. The current usage metrics is available 48-96 hours after online publication and is updated daily on week days.
Initial download of the metrics may take a while.