Fig. 4.
Download original image
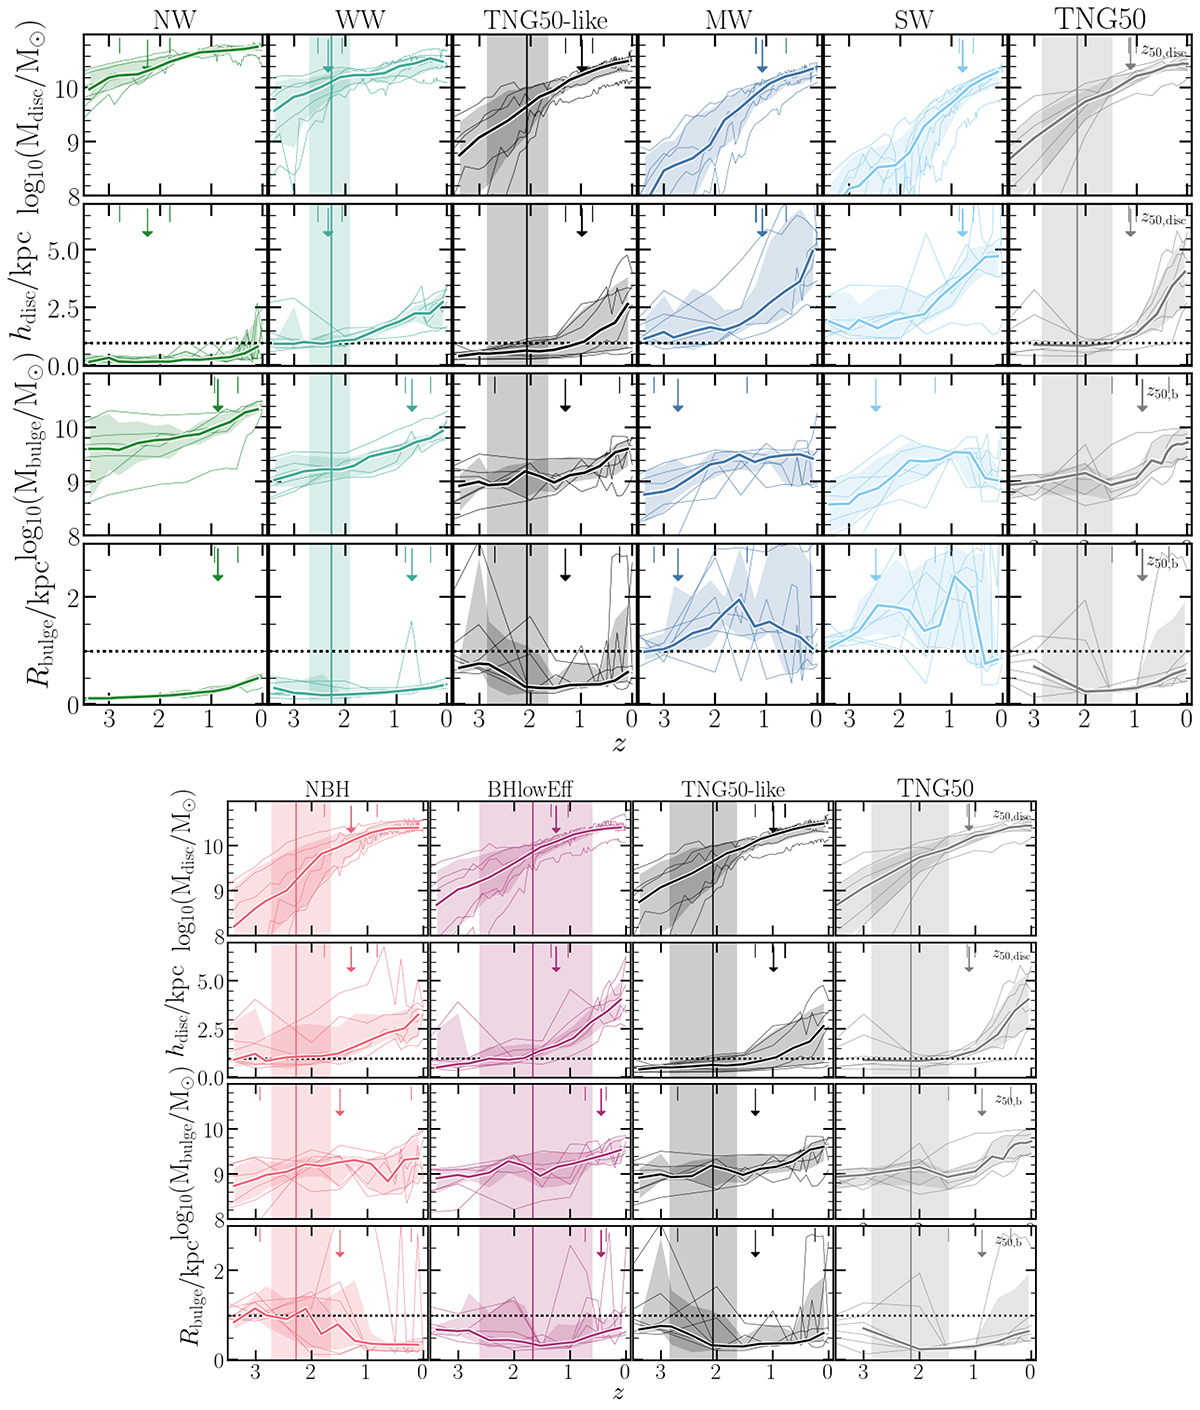
Mass and size evolution of discs and bulges. Galactic winds model variations (top) and quasar BH physics model variations (bottom). The last column shows the original TNG50. Solid lines and shaded regions represent median values and the 20th to 80th percentile distribution. Thinner lines correspond to the evolution of each galaxy. Vertical solid lines denote bar formation median redshift, and shaded regions its scatter. Arrows with small vertical lines correspond to the median redshift formation of the disc/bulge (![]() /zb) and its scatter. Stronger SN feedback delays disc buildup and makes discs more extended.
/zb) and its scatter. Stronger SN feedback delays disc buildup and makes discs more extended.
Current usage metrics show cumulative count of Article Views (full-text article views including HTML views, PDF and ePub downloads, according to the available data) and Abstracts Views on Vision4Press platform.
Data correspond to usage on the plateform after 2015. The current usage metrics is available 48-96 hours after online publication and is updated daily on week days.
Initial download of the metrics may take a while.