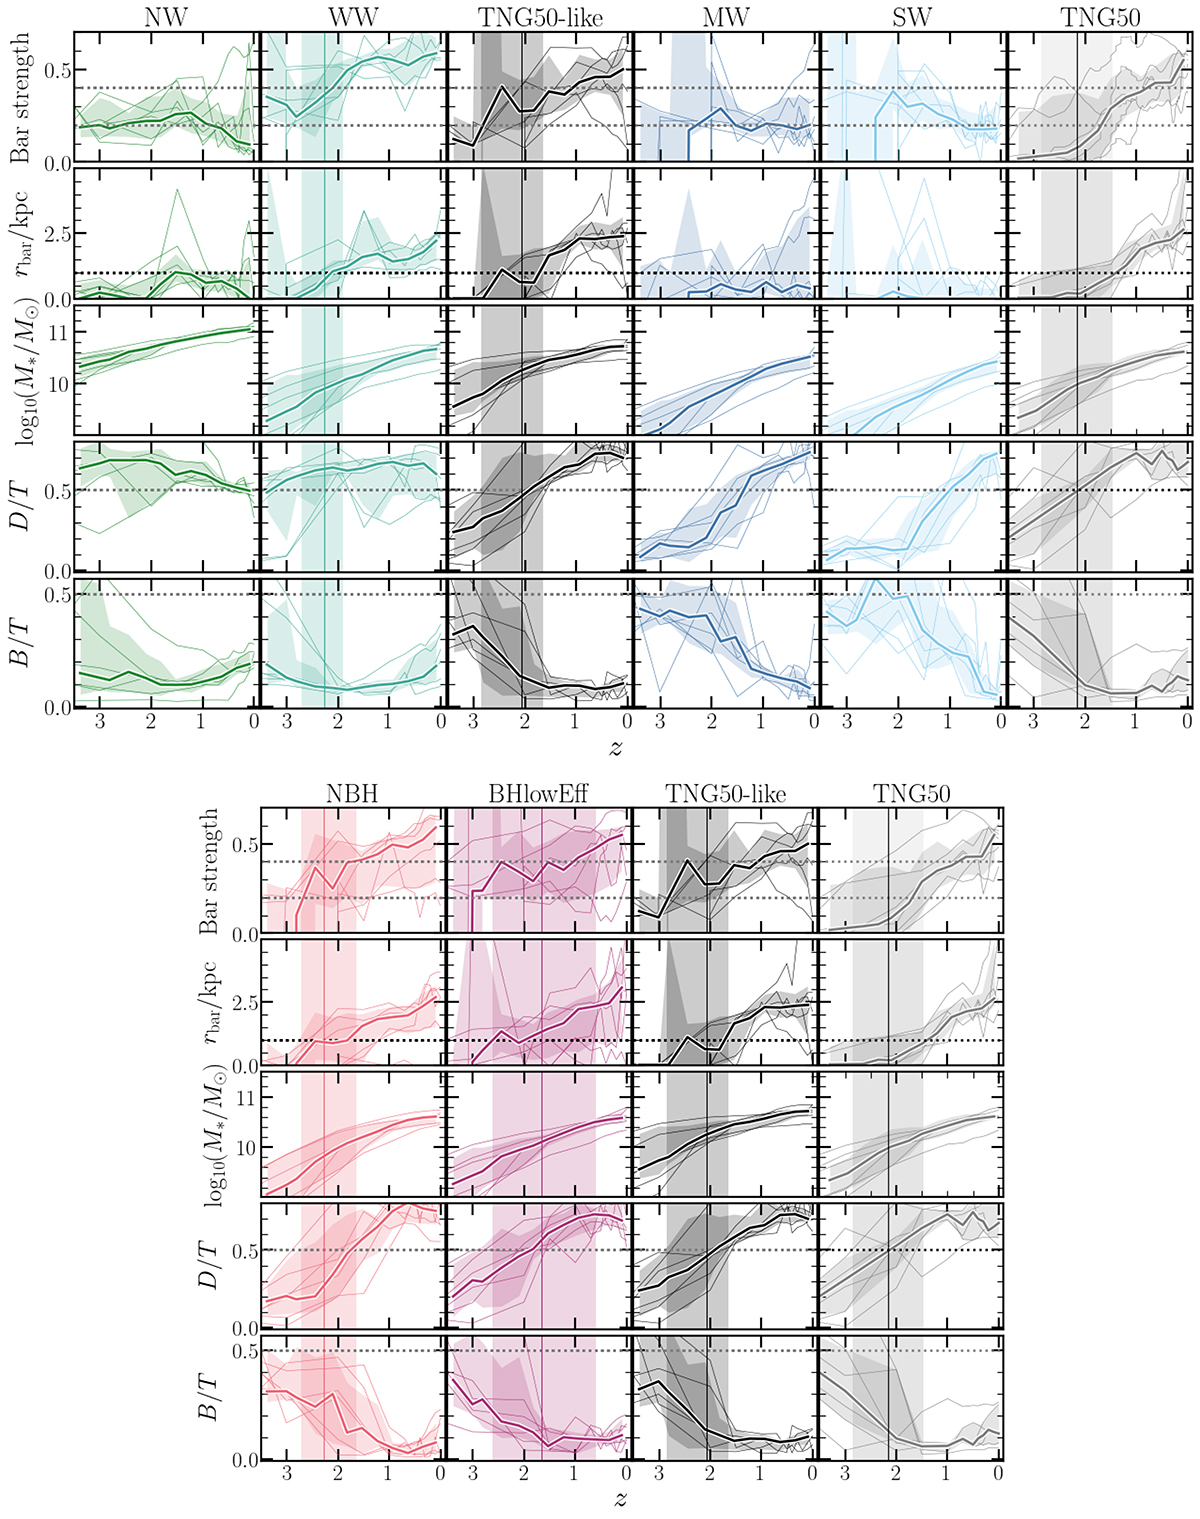
Fig. 3.
Download original image
Median evolution of the bar and galaxy morphology for simulations with different galactic wind (top) and BH feedback (bottom) models. Each column corresponds to a different model, as indicated in the figures. From top to bottom rows, the bar strength, bar extent, the stellar mass, and the disc-to-total and bulge-to-total mass fraction are shown. The medians and the distribution between 20th and 80th percentiles correspond to solid lines and shaded regions, respectively. Thinner solid lines correspond to the evolution of individual galaxies. Vertical solid lines and shaded region represent the median redshift and the distribution between 20th and 80th percentiles of the bar formation time. The stronger the wind, the lower the probability of the galaxy developing a bar, except for the no-wind galaxy. The build-up of a well-defined massive cold disc is delayed for stronger galactic wind models. No significant change is seen in the black hole variation models.
Current usage metrics show cumulative count of Article Views (full-text article views including HTML views, PDF and ePub downloads, according to the available data) and Abstracts Views on Vision4Press platform.
Data correspond to usage on the plateform after 2015. The current usage metrics is available 48-96 hours after online publication and is updated daily on week days.
Initial download of the metrics may take a while.