Fig. 2.
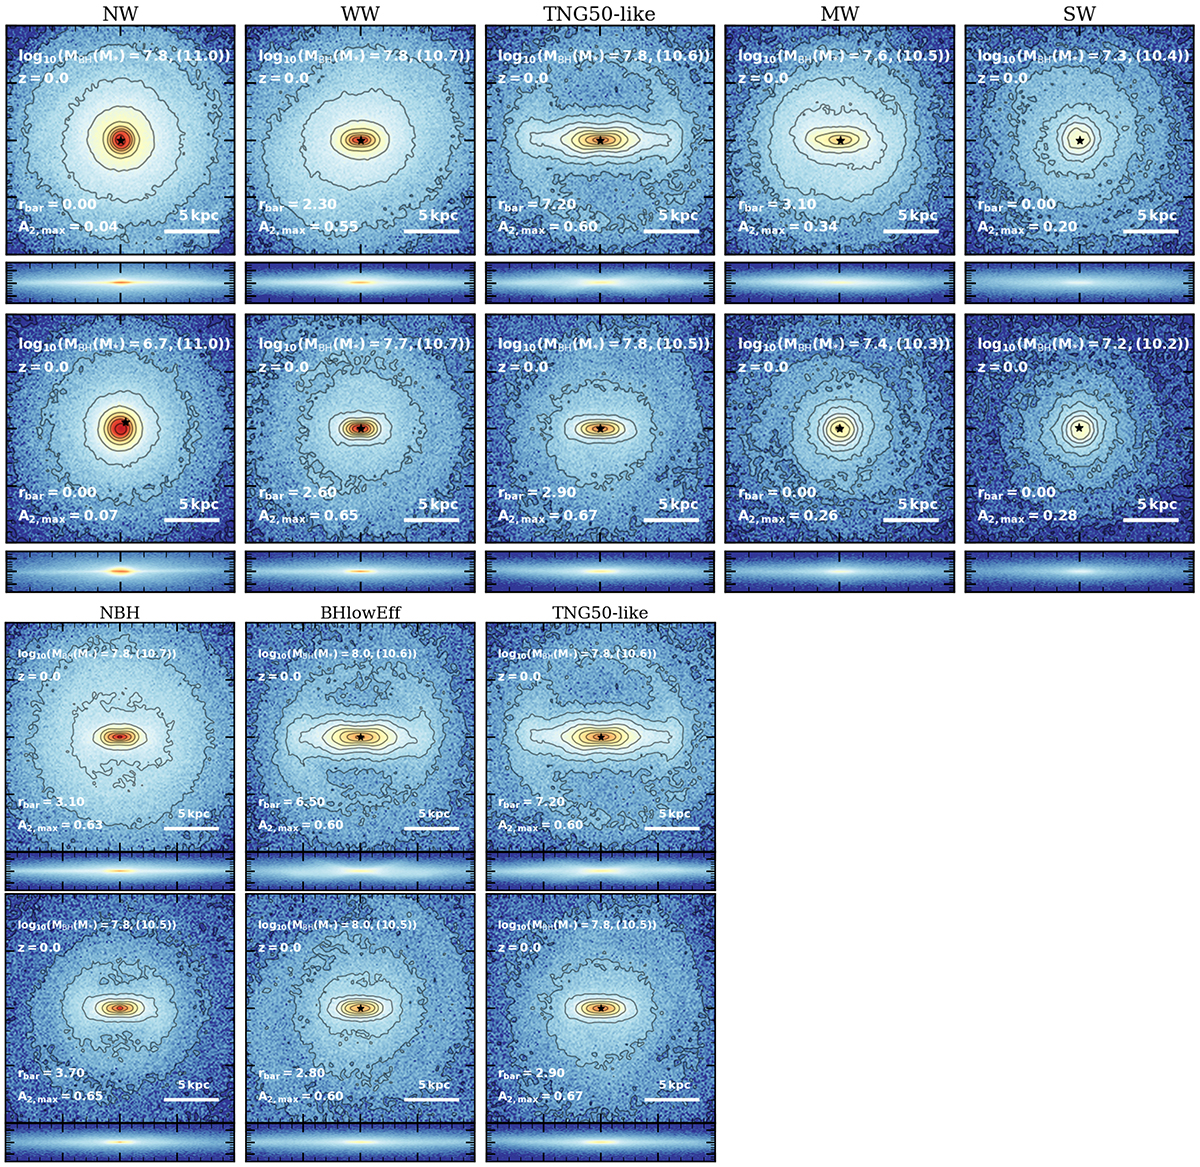
Download original image
Face-on stellar density maps of two distinct galaxies at z = 0. The top figure shows the wind model variations, and each column corresponds to a distinct wind model. The left column shows a galaxy without SN feedback, and the right columns show galaxies with stronger SN feedback. The bottom figure shows different quasar black hole models but with the same SNe feedback model as indicated by Table 2. The black star symbolises the location of the BH. In both the no wind and strong wind models, the disc galaxy does not exhibit the formation of a bar. Quasar BH physics appear to have a limited influence on the formation of a bar.
Current usage metrics show cumulative count of Article Views (full-text article views including HTML views, PDF and ePub downloads, according to the available data) and Abstracts Views on Vision4Press platform.
Data correspond to usage on the plateform after 2015. The current usage metrics is available 48-96 hours after online publication and is updated daily on week days.
Initial download of the metrics may take a while.